Rebin X-MET along-track
The AUX_MET_1D (X-MET) product stores modeled meteorological parameters from ECMWF in a spacial grid around the EarthCARE swath. To match the vertical along-track cross-section of another Product, X-MET data can be rebinned (by interpolation) using the rebin_xmet_to_vertical_track function.
import earthcarekit as eck

file_types = ["anom", "xmet"]
orbit_and_frame = "01508B"

# Download required data
eck.ecdownload(
    file_type=file_types,
    orbit_and_frame=orbit_and_frame,
)

# Get product file paths
df = eck.search_product(
    file_type=file_types,
    orbit_and_frame=orbit_and_frame,
)
fp_anom = df.filter_file_type("anom").filepath[-1]
fp_xmet = df.filter_file_type("xmet").filepath[-1]

# Open both datasets
with (
    eck.read_product(fp_anom) as ds_anom,
    eck.read_product(fp_xmet) as ds_xmet_original,
):
    print(f"A-NOM dims: {ds_anom.sizes}")
    print(f"X-MET dims before rebin: {ds_xmet_original.sizes}")

    # Rebin X-MET to A-NOM along_track/vertical grid
    ds_xmet = eck.rebin_xmet_to_vertical_track(
        ds_xmet=ds_xmet_original,
        ds_vert=ds_anom,
    )

    print(f"X-MET dims after rebin: {ds_xmet.sizes}")
See output ...
A-NOM dims: Frozen({'along_track': 18023, 'height_raw': 256, 'background': 2, 'vertical': 254, 'segments': 6})
X-MET dims before rebin: Frozen({'horizontal_grid': 25615, 'height': 137})
X-MET dims after rebin: Frozen({'along_track': 18023, 'vertical': 254})
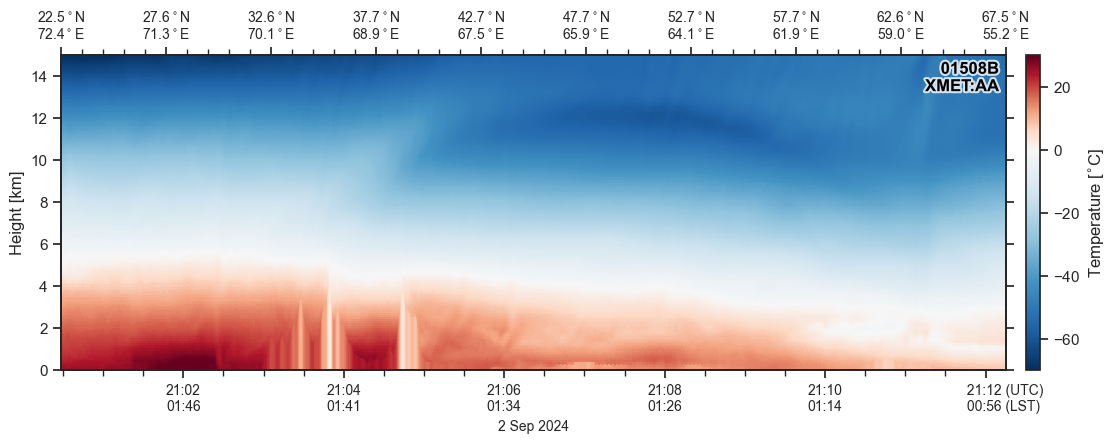
Plotting examples
cf = eck.CurtainFigure()
cf = cf.ecplot(
ds=ds_xmet,
var="temperature_celsius",
height_range=(0, 15e3),
value_range=(-70, 30),
cmap=eck.shift_cmap("RdBu_r", midpoint=0.7),
)
cf.save(filepath="xmet_curtain.png")
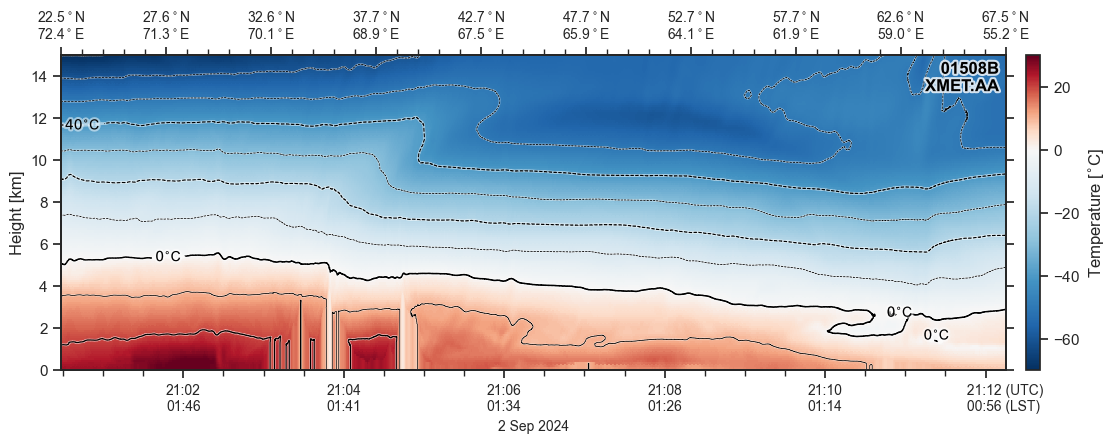
cf.ecplot_temperature(ds_xmet)
cf.save(filepath="xmet_curtain_with_temperature_lines.png")
xmet_curtain.png |
xmet_curtain_with_temperature_lines.png |
 |
 |
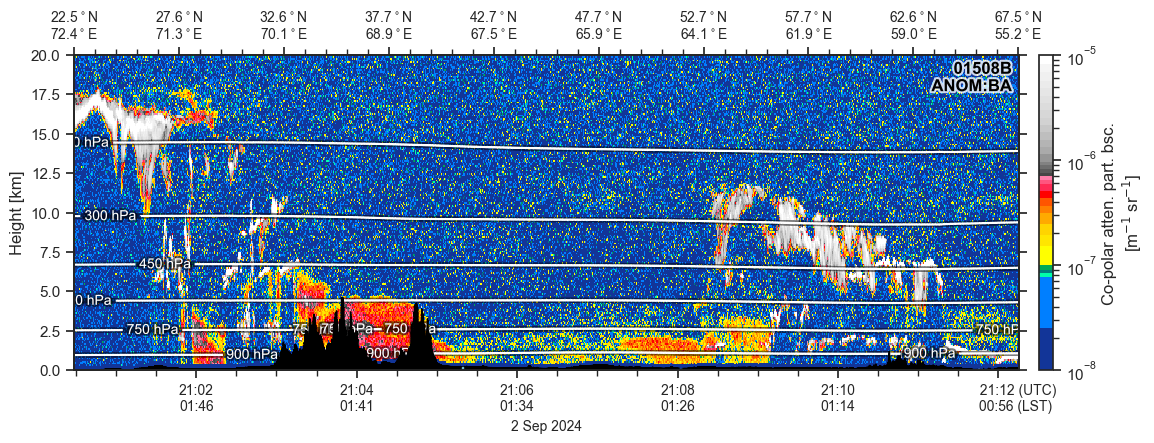
cf2 = eck.CurtainFigure()
cf2 = cf2.ecplot(
    ds=ds_anom,
    var="mie_attenuated_backscatter",
    height_range=(0, 20e3),
)
cf2.ecplot_pressure(ds_xmet, colors="white")
cf2.ecplot_elevation(ds_anom, color="black")
cf2.save(filepath="anom_curtain_with_pressure_lines.png")
anom_curtain_with_pressure_lines.png |
 |
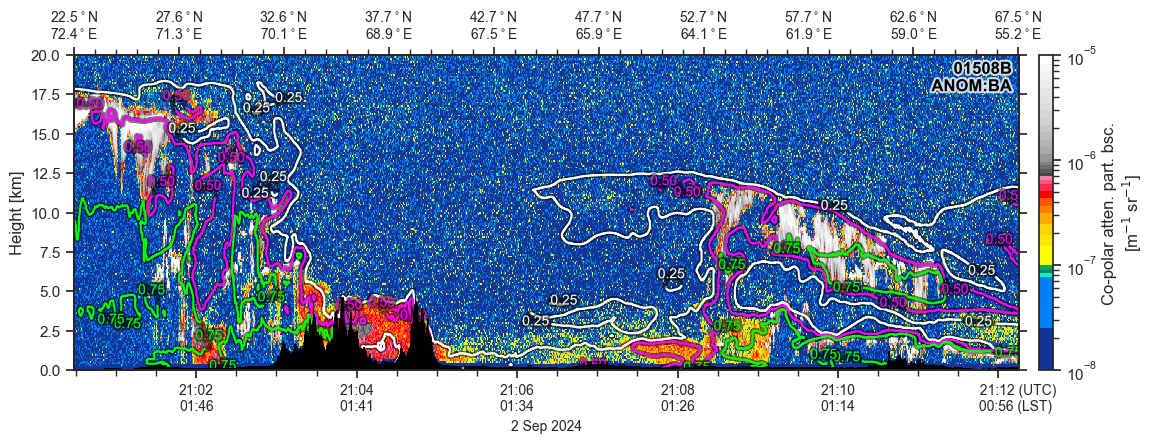
cf3 = eck.CurtainFigure()
cf3 = cf3.ecplot(
    ds=ds_anom,
    var="mie_attenuated_backscatter",
    height_range=(0, 20e3),
)
cf3 = cf3.ecplot_contour(
    ds=ds_xmet,
    var="relative_humidity",
    levels=[0.25, 0.5, 0.75],
    colors=["white", "magenta", "lime"],
    # linestyles=...,
    # linewidths=...,
)
cf3.ecplot_elevation(ds_anom, color="black")
cf3.save(filepath="anom_curtain_with_xmet_lines.png")
anom_curtain_with_xmet_lines.png |
 |