Skip to content

API reference

earthcarekit.plot

Plotting utilities.

Notes

This module depends on other internal modules:


Cmap

Bases: ListedColormap

Colormap with categorical, gradient, and circular support.

This subclass of matplotlib.colors.ListedColormap adds utilities for continuous and categorical color mappings. Supports labels, ticks, normalization, blending, and transparency adjustments.

Attributes:

Name Type Description
categorical bool

Whether the colormap is discrete/categorical.

gradient bool

Whether the colormap was generated from a gradient.

circular bool

Whether the colormap wraps around cyclically.

ticks list[float]

Optional tick positions for categorical plots.

labels list[str]

Optional labels corresponding to ticks.

norm Normalize | None

Normalization strategy for value mapping.

values list

Associated values for categorical mapping.

Source code in earthcarekit/colormap/_cmap.py
class Cmap(ListedColormap):
    """Colormap with categorical, gradient, and circular support.

    This subclass of `matplotlib.colors.ListedColormap` adds utilities for
    continuous and categorical color mappings. Supports labels, ticks,
    normalization, blending, and transparency adjustments.

    Attributes:
        categorical (bool): Whether the colormap is discrete/categorical.
        gradient (bool): Whether the colormap was generated from a gradient.
        circular (bool): Whether the colormap wraps around cyclically.
        ticks (list[float]): Optional tick positions for categorical plots.
        labels (list[str]): Optional labels corresponding to ticks.
        norm (Normalize | None): Normalization strategy for value mapping.
        values (list): Associated values for categorical mapping.
    """

    def __init__(
        self,
        colors: Sequence,
        name: str = "colormap",
        N: int | None = None,
        categorical: bool = False,
        ticks: List[float] | None = None,
        labels: List[str] | None = None,
        norm: Normalize | None = None,
        values: List | None = None,
        gradient: bool = False,
        circular: bool = False,
    ):
        """Initialize a Cmap.

        Args:
            colors (Sequence): Sequence of colors (strings or ColorLike objects).
            name (str): Name of the colormap. Defaults to "colormap".
            N (int | None): Number of discrete colors. Defaults to None.
            categorical (bool): Whether the colormap is discrete/categorical. Defaults to False.
            ticks (list[float] | None): Optional tick positions for categorical plots. Defaults to None.
            labels (list[str] | None): Optional labels corresponding to ticks. Defaults to None.
            norm (Normalize | None): Normalization strategy for value mapping. Defaults to None.
            gradient (bool): If True, generate intermediate gradient colors. Defaults to False.
            circular (bool): If True, colormap wraps around cyclically. Defaults to False.
        """
        _colors: list = [Color(c) if isinstance(c, str) else c for c in colors]

        if gradient:
            tmp_cmap = LinearSegmentedColormap.from_list("tmp_cmap", _colors, N=256)
            _colors = [tmp_cmap(i) for i in range(256)]

        super().__init__(_colors, name=name, N=N or len(_colors))
        self.categorical = categorical
        self.gradient = gradient
        self.circular = circular
        self.ticks = ticks or []
        self.labels = labels or []
        self.norm = norm
        self.values = values or []

    @classmethod
    def from_colormap(cls, cmap: Colormap, N: int = 256, name: str | None = None) -> "Cmap":
        """Create a Cmap instance from an existing Matplotlib colormap.

        Args:
            cmap (Colormap): Source colormap to convert.
            N (int): Number of discrete colors (if needed, e.g, for categorical
                colormaps with limited number of colors). Defaults to 256.

        Returns:
            Cmap: New colormap.
        """
        if isinstance(cmap, cls):
            return cmap
        elif isinstance(cmap, ListedColormap):
            colors = list(cmap.colors)  # type: ignore
            if isinstance(colors, np.ndarray) and colors.ndim == 2:
                N = len(colors)
            else:
                N = cmap.N
        else:
            colors = [cmap(x) for x in np.linspace(0, 1, N)]

        _colors = []
        for c in colors:
            if (
                isinstance(c, (np.ndarray, list, tuple))
                and not isinstance(c, str)
                and all([_c <= 1 for _c in c])
            ):
                _colors.append(Color(c, is_normalized=True))  # type: ignore
            else:
                _colors = [Color(c) for c in colors]  # type: ignore
                continue
        new_cmap = cls(
            [c.hex for c in _colors],
            name=name or cmap.name,
            N=N,
        )
        new_cmap = copy_extremes(cmap, new_cmap)
        return new_cmap

    def copy(self) -> "Cmap":
        new_cmap = Cmap(
            colors=cast(Sequence, self.colors),
            name=self.name,
            N=self.N,
            categorical=self.categorical,
            ticks=self.ticks,
            labels=self.labels,
            norm=self.norm,
            values=self.values,
            gradient=self.gradient,
            circular=self.circular,
        )
        return copy_extremes(self, new_cmap)

    def to_categorical(
        self,
        values_to_labels: Dict[Any, str] | int,
        endpoint: bool | None = None,
        use_discrete: bool | None = None,
    ) -> "Cmap":
        """Convert a colormap to categorical.

        Args:
            values_to_labels (dict | int): Mapping from values to labels, or
                number of categories if int.
            endpoint (bool | None): Whether the last color is included at 1.0.
            use_discrete (bool | None): If True, use the colormap's defined colors directly rather than sampling across its range.

        Returns:
            Cmap: Categorical version of the colormap.
        """
        if isinstance(values_to_labels, int):
            values_to_labels = {i: str(i) for i in range(values_to_labels)}

        values_to_labels = dict(sorted(values_to_labels.items()))

        keys = list(values_to_labels.keys())
        labels = list(values_to_labels.values())
        sorted_values = keys

        n_classes = len(sorted_values)
        bounds = np.array(sorted_values + [sorted_values[-1] + 1]) - 0.5
        norm = BoundaryNorm(bounds, n_classes)

        ticks = [float(t) for t in np.arange(0.5, n_classes)]

        if use_discrete:
            colors = [self(i) for i in range(n_classes)]
        else:
            if not isinstance(endpoint, bool):
                endpoint = not self.circular
            offset = -1 if endpoint else 0
            colors = [self(i / max(n_classes + offset, 1)) for i in range(n_classes)]

        return Cmap(
            colors=colors,
            name=self.name,
            N=n_classes,
            categorical=True,
            gradient=False,
            circular=self.circular,
            ticks=ticks,
            labels=labels,
            norm=norm,
            values=sorted_values,
        )

    def to_discrete(self, n: int) -> "Cmap":
        """Convert a colormap to a discretized version of itself.

        Args:
            n (int): Number of steps (i.e., discrete colors).

        Returns:
            Cmap: Discretized version of the colormap.
        """
        new_cmap = self.to_categorical(n)
        new_cmap.categorical = False
        new_cmap.ticks = []
        new_cmap.labels = []
        new_cmap.norm = None
        new_cmap.values = []
        return new_cmap

    def set_alpha(self, value: float) -> "Cmap":
        """Return a copy of the colormap with modified alpha transparency.

        Args:
            value (float): Alpha value in the range [0, 1].

        Returns:
            Cmap: Colormap with updated transparency.
        """
        if not 0 <= value <= 1:
            raise ValueError(f"Invalid alpha value: '{value}' (must be in the 0-1 range)")

        new_cmap = Cmap(
            colors=[Color(c).set_alpha(value) for c in np.asarray(self.colors)],
            name=self.name,
            N=self.N,
            categorical=self.categorical,
            gradient=self.gradient,
            circular=self.circular,
            ticks=self.ticks,
            labels=self.labels,
            norm=self.norm,
        )

        if self._rgba_bad is not None:  # type: ignore
            new_cmap._rgba_bad = Color(self._rgba_bad, is_normalized=True).set_alpha(value).rgba  # type: ignore
        if self._rgba_over is not None:  # type: ignore
            new_cmap._rgba_over = Color(self._rgba_over, is_normalized=True).set_alpha(value).rgba  # type: ignore
        if self._rgba_under is not None:  # type: ignore
            new_cmap._rgba_under = Color(self._rgba_under, is_normalized=True).set_alpha(value).rgba  # type: ignore

        return new_cmap

    def blend(self, value: float, blend_color: Color | ColorLike = "white") -> "Cmap":
        """Return a copy of the colormap blended with a second color.

        Args:
            value (float): Blend factor in the range [0, 1].
            blend_color (Color | str): Color to blend with.

        Returns:
            Cmap: Blended colormap.
        """
        if not 0 <= value <= 1:
            raise ValueError(f"Invalid blend value: '{value}' (must be in the 0-1 range)")

        new_cmap = Cmap(
            colors=[Color(c).blend(value, blend_color) for c in np.asarray(self.colors)],
            name=self.name,
            N=self.N,
            categorical=self.categorical,
            gradient=self.gradient,
            circular=self.circular,
            ticks=self.ticks,
            labels=self.labels,
            norm=self.norm,
        )

        if self._rgba_bad is not None:  # type: ignore
            new_cmap._rgba_bad = (  # type: ignore
                Color(self._rgba_bad, is_normalized=True).blend(value, blend_color).rgba  # type: ignore
            )  # type: ignore
        if self._rgba_over is not None:  # type: ignore
            new_cmap._rgba_over = (  # type: ignore
                Color(self._rgba_over, is_normalized=True).blend(value, blend_color).rgba  # type: ignore
            )  # type: ignore
        if self._rgba_under is not None:  # type: ignore
            new_cmap._rgba_under = (  # type: ignore
                Color(self._rgba_under, is_normalized=True).blend(value, blend_color).rgba  # type: ignore
            )  # type: ignore

        return new_cmap

    @property
    def rgba_list(self) -> list[tuple[float, ...]]:
        """List of RGBA tuples representing all colors in the colormap."""
        return [Color(c, is_normalized=True).rgba for c in np.array(self.colors)]

    # def set_alpha_gradient(self, alpha_input: list) -> "Cmap":
    #     from matplotlib.colors import ListedColormap
    #     from scipy.interpolate import interp1d

    #     # Interpolate to 256 values
    #     n_colors = 256
    #     x_old = np.linspace(0, 1, len(alpha_input))
    #     x_new = np.linspace(0, 1, n_colors)
    #     alpha_interp = interp1d(x_old, alpha_input, kind="linear")(x_new)

    #     # Get base colormap and apply interpolated alpha
    #     colors = self(np.linspace(0, 1, n_colors))
    #     colors[:, 3] = alpha_interp  # Replace alpha channel

    #     # Create transparent colormap
    #     new_cmap = Cmap(colors, name=self.name)

    @property
    def opaque(self) -> "Cmap":
        """Return an opaque version of the colormap (alpha set to 1)."""
        return colormap_to_opaque(self)

    @property
    def alphamap(self) -> "Cmap":
        """Return the alpha-mapped version of the colormap."""
        return colormap_to_alphamap(self)

    @property
    def blended(self) -> "Cmap":
        """Return a blended version of the colormap (predefined blending)."""
        return colormap_to_blended(self)

    def __new__(cls, *args, **kwargs):
        """Allow instantiation from an existing Colormap or standard arguments."""
        if len(args) == 1 and isinstance(args[0], Colormap):
            return cls.from_colormap(args[0])
        return super().__new__(cls)

    def reversed(self, name: str | None = None) -> "Cmap":
        return Cmap(
            colors=cast(Sequence, super().reversed(name).colors),
            name=name or self.name.removesuffix("_r")
            if self.name.endswith("_r")
            else self.name + "_r",
            N=self.N,
            categorical=self.categorical,
            ticks=list(reversed(self.ticks)),
            labels=list(reversed(self.labels)),
            norm=self.norm,
            values=list(reversed(self.values)),
            gradient=self.gradient,
            circular=self.circular,
        )

__init__

__init__(
    colors: Sequence,
    name: str = "colormap",
    N: int | None = None,
    categorical: bool = False,
    ticks: List[float] | None = None,
    labels: List[str] | None = None,
    norm: Normalize | None = None,
    values: List | None = None,
    gradient: bool = False,
    circular: bool = False,
)

Initialize a Cmap.

Parameters:

Name Type Description Default
colors Sequence

Sequence of colors (strings or ColorLike objects).

required
name str

Name of the colormap. Defaults to "colormap".

'colormap'
N int | None

Number of discrete colors. Defaults to None.

None
categorical bool

Whether the colormap is discrete/categorical. Defaults to False.

False
ticks list[float] | None

Optional tick positions for categorical plots. Defaults to None.

None
labels list[str] | None

Optional labels corresponding to ticks. Defaults to None.

None
norm Normalize | None

Normalization strategy for value mapping. Defaults to None.

None
gradient bool

If True, generate intermediate gradient colors. Defaults to False.

False
circular bool

If True, colormap wraps around cyclically. Defaults to False.

False
Source code in earthcarekit/colormap/_cmap.py
def __init__(
    self,
    colors: Sequence,
    name: str = "colormap",
    N: int | None = None,
    categorical: bool = False,
    ticks: List[float] | None = None,
    labels: List[str] | None = None,
    norm: Normalize | None = None,
    values: List | None = None,
    gradient: bool = False,
    circular: bool = False,
):
    """Initialize a Cmap.

    Args:
        colors (Sequence): Sequence of colors (strings or ColorLike objects).
        name (str): Name of the colormap. Defaults to "colormap".
        N (int | None): Number of discrete colors. Defaults to None.
        categorical (bool): Whether the colormap is discrete/categorical. Defaults to False.
        ticks (list[float] | None): Optional tick positions for categorical plots. Defaults to None.
        labels (list[str] | None): Optional labels corresponding to ticks. Defaults to None.
        norm (Normalize | None): Normalization strategy for value mapping. Defaults to None.
        gradient (bool): If True, generate intermediate gradient colors. Defaults to False.
        circular (bool): If True, colormap wraps around cyclically. Defaults to False.
    """
    _colors: list = [Color(c) if isinstance(c, str) else c for c in colors]

    if gradient:
        tmp_cmap = LinearSegmentedColormap.from_list("tmp_cmap", _colors, N=256)
        _colors = [tmp_cmap(i) for i in range(256)]

    super().__init__(_colors, name=name, N=N or len(_colors))
    self.categorical = categorical
    self.gradient = gradient
    self.circular = circular
    self.ticks = ticks or []
    self.labels = labels or []
    self.norm = norm
    self.values = values or []

__new__

__new__(*args, **kwargs)

Allow instantiation from an existing Colormap or standard arguments.

Source code in earthcarekit/colormap/_cmap.py
def __new__(cls, *args, **kwargs):
    """Allow instantiation from an existing Colormap or standard arguments."""
    if len(args) == 1 and isinstance(args[0], Colormap):
        return cls.from_colormap(args[0])
    return super().__new__(cls)

alphamap property

alphamap: Cmap

Return the alpha-mapped version of the colormap.

blend

blend(value: float, blend_color: Color | ColorLike = 'white') -> Cmap

Return a copy of the colormap blended with a second color.

Parameters:

Name Type Description Default
value float

Blend factor in the range [0, 1].

required
blend_color Color | str

Color to blend with.

'white'

Returns:

Name Type Description
Cmap Cmap

Blended colormap.

Source code in earthcarekit/colormap/_cmap.py
def blend(self, value: float, blend_color: Color | ColorLike = "white") -> "Cmap":
    """Return a copy of the colormap blended with a second color.

    Args:
        value (float): Blend factor in the range [0, 1].
        blend_color (Color | str): Color to blend with.

    Returns:
        Cmap: Blended colormap.
    """
    if not 0 <= value <= 1:
        raise ValueError(f"Invalid blend value: '{value}' (must be in the 0-1 range)")

    new_cmap = Cmap(
        colors=[Color(c).blend(value, blend_color) for c in np.asarray(self.colors)],
        name=self.name,
        N=self.N,
        categorical=self.categorical,
        gradient=self.gradient,
        circular=self.circular,
        ticks=self.ticks,
        labels=self.labels,
        norm=self.norm,
    )

    if self._rgba_bad is not None:  # type: ignore
        new_cmap._rgba_bad = (  # type: ignore
            Color(self._rgba_bad, is_normalized=True).blend(value, blend_color).rgba  # type: ignore
        )  # type: ignore
    if self._rgba_over is not None:  # type: ignore
        new_cmap._rgba_over = (  # type: ignore
            Color(self._rgba_over, is_normalized=True).blend(value, blend_color).rgba  # type: ignore
        )  # type: ignore
    if self._rgba_under is not None:  # type: ignore
        new_cmap._rgba_under = (  # type: ignore
            Color(self._rgba_under, is_normalized=True).blend(value, blend_color).rgba  # type: ignore
        )  # type: ignore

    return new_cmap

blended property

blended: Cmap

Return a blended version of the colormap (predefined blending).

from_colormap classmethod

from_colormap(cmap: Colormap, N: int = 256, name: str | None = None) -> Cmap

Create a Cmap instance from an existing Matplotlib colormap.

Parameters:

Name Type Description Default
cmap Colormap

Source colormap to convert.

required
N int

Number of discrete colors (if needed, e.g, for categorical colormaps with limited number of colors). Defaults to 256.

256

Returns:

Name Type Description
Cmap Cmap

New colormap.

Source code in earthcarekit/colormap/_cmap.py
@classmethod
def from_colormap(cls, cmap: Colormap, N: int = 256, name: str | None = None) -> "Cmap":
    """Create a Cmap instance from an existing Matplotlib colormap.

    Args:
        cmap (Colormap): Source colormap to convert.
        N (int): Number of discrete colors (if needed, e.g, for categorical
            colormaps with limited number of colors). Defaults to 256.

    Returns:
        Cmap: New colormap.
    """
    if isinstance(cmap, cls):
        return cmap
    elif isinstance(cmap, ListedColormap):
        colors = list(cmap.colors)  # type: ignore
        if isinstance(colors, np.ndarray) and colors.ndim == 2:
            N = len(colors)
        else:
            N = cmap.N
    else:
        colors = [cmap(x) for x in np.linspace(0, 1, N)]

    _colors = []
    for c in colors:
        if (
            isinstance(c, (np.ndarray, list, tuple))
            and not isinstance(c, str)
            and all([_c <= 1 for _c in c])
        ):
            _colors.append(Color(c, is_normalized=True))  # type: ignore
        else:
            _colors = [Color(c) for c in colors]  # type: ignore
            continue
    new_cmap = cls(
        [c.hex for c in _colors],
        name=name or cmap.name,
        N=N,
    )
    new_cmap = copy_extremes(cmap, new_cmap)
    return new_cmap

opaque property

opaque: Cmap

Return an opaque version of the colormap (alpha set to 1).

rgba_list property

rgba_list: list[tuple[float, ...]]

List of RGBA tuples representing all colors in the colormap.

set_alpha

set_alpha(value: float) -> Cmap

Return a copy of the colormap with modified alpha transparency.

Parameters:

Name Type Description Default
value float

Alpha value in the range [0, 1].

required

Returns:

Name Type Description
Cmap Cmap

Colormap with updated transparency.

Source code in earthcarekit/colormap/_cmap.py
def set_alpha(self, value: float) -> "Cmap":
    """Return a copy of the colormap with modified alpha transparency.

    Args:
        value (float): Alpha value in the range [0, 1].

    Returns:
        Cmap: Colormap with updated transparency.
    """
    if not 0 <= value <= 1:
        raise ValueError(f"Invalid alpha value: '{value}' (must be in the 0-1 range)")

    new_cmap = Cmap(
        colors=[Color(c).set_alpha(value) for c in np.asarray(self.colors)],
        name=self.name,
        N=self.N,
        categorical=self.categorical,
        gradient=self.gradient,
        circular=self.circular,
        ticks=self.ticks,
        labels=self.labels,
        norm=self.norm,
    )

    if self._rgba_bad is not None:  # type: ignore
        new_cmap._rgba_bad = Color(self._rgba_bad, is_normalized=True).set_alpha(value).rgba  # type: ignore
    if self._rgba_over is not None:  # type: ignore
        new_cmap._rgba_over = Color(self._rgba_over, is_normalized=True).set_alpha(value).rgba  # type: ignore
    if self._rgba_under is not None:  # type: ignore
        new_cmap._rgba_under = Color(self._rgba_under, is_normalized=True).set_alpha(value).rgba  # type: ignore

    return new_cmap

to_categorical

to_categorical(
    values_to_labels: Dict[Any, str] | int,
    endpoint: bool | None = None,
    use_discrete: bool | None = None,
) -> Cmap

Convert a colormap to categorical.

Parameters:

Name Type Description Default
values_to_labels dict | int

Mapping from values to labels, or number of categories if int.

required
endpoint bool | None

Whether the last color is included at 1.0.

None
use_discrete bool | None

If True, use the colormap's defined colors directly rather than sampling across its range.

None

Returns:

Name Type Description
Cmap Cmap

Categorical version of the colormap.

Source code in earthcarekit/colormap/_cmap.py
def to_categorical(
    self,
    values_to_labels: Dict[Any, str] | int,
    endpoint: bool | None = None,
    use_discrete: bool | None = None,
) -> "Cmap":
    """Convert a colormap to categorical.

    Args:
        values_to_labels (dict | int): Mapping from values to labels, or
            number of categories if int.
        endpoint (bool | None): Whether the last color is included at 1.0.
        use_discrete (bool | None): If True, use the colormap's defined colors directly rather than sampling across its range.

    Returns:
        Cmap: Categorical version of the colormap.
    """
    if isinstance(values_to_labels, int):
        values_to_labels = {i: str(i) for i in range(values_to_labels)}

    values_to_labels = dict(sorted(values_to_labels.items()))

    keys = list(values_to_labels.keys())
    labels = list(values_to_labels.values())
    sorted_values = keys

    n_classes = len(sorted_values)
    bounds = np.array(sorted_values + [sorted_values[-1] + 1]) - 0.5
    norm = BoundaryNorm(bounds, n_classes)

    ticks = [float(t) for t in np.arange(0.5, n_classes)]

    if use_discrete:
        colors = [self(i) for i in range(n_classes)]
    else:
        if not isinstance(endpoint, bool):
            endpoint = not self.circular
        offset = -1 if endpoint else 0
        colors = [self(i / max(n_classes + offset, 1)) for i in range(n_classes)]

    return Cmap(
        colors=colors,
        name=self.name,
        N=n_classes,
        categorical=True,
        gradient=False,
        circular=self.circular,
        ticks=ticks,
        labels=labels,
        norm=norm,
        values=sorted_values,
    )

to_discrete

to_discrete(n: int) -> Cmap

Convert a colormap to a discretized version of itself.

Parameters:

Name Type Description Default
n int

Number of steps (i.e., discrete colors).

required

Returns:

Name Type Description
Cmap Cmap

Discretized version of the colormap.

Source code in earthcarekit/colormap/_cmap.py
def to_discrete(self, n: int) -> "Cmap":
    """Convert a colormap to a discretized version of itself.

    Args:
        n (int): Number of steps (i.e., discrete colors).

    Returns:
        Cmap: Discretized version of the colormap.
    """
    new_cmap = self.to_categorical(n)
    new_cmap.categorical = False
    new_cmap.ticks = []
    new_cmap.labels = []
    new_cmap.norm = None
    new_cmap.values = []
    return new_cmap

Color dataclass

Bases: str

Represents a color with convenient conversion, blending, and alpha support.

Extends str to store a color as a hex string while providing methods to access RGB/RGBA, set transparency, blend with other colors, and normalize input from various formats.

Attributes:

Name Type Description
input ColorLike

Original input used to create the color.

name str | None

Optional name of the color.

is_normalized bool

Whether the color values are normalized (0-1).

Source code in earthcarekit/color/_color.py
@dataclass(frozen=True)
class Color(str):
    """Represents a color with convenient conversion, blending, and alpha support.

    Extends `str` to store a color as a hex string while providing methods
    to access RGB/RGBA, set transparency, blend with other colors, and
    normalize input from various formats.

    Attributes:
        input (ColorLike): Original input used to create the color.
        name (str | None): Optional name of the color.
        is_normalized (bool): Whether the color values are normalized (0-1).
    """

    input: ColorLike
    name: str | None = None
    is_normalized: bool = False

    def __new__(
        cls,
        color_input: "Color" | ColorLike,
        name: str | None = None,
        is_normalized: bool = False,
    ):
        """Create a Color instance from a color-like input."""
        hex_color = cls._to_hex(color_input, is_normalized=is_normalized)
        return str.__new__(cls, hex_color)

    def __init__(
        self,
        color_input: "Color" | ColorLike,
        name: str | None = None,
        is_normalized: bool = False,
    ):
        """Initialize Color attributes."""
        object.__setattr__(self, "input", color_input)
        object.__setattr__(self, "name", name)
        object.__setattr__(self, "is_normalized", is_normalized)

    def __hash__(self):
        """Return the hash of the color string."""
        return hash(str(self))

    @classmethod
    def _rgb_str_to_hex(
        cls,
        rgb_string: str,
        is_normalized: bool = False,
    ) -> str:
        """Convert an 'rgb(...)' string to a hex color."""
        if (not is_normalized and re.match(r"^rgb\(\d*,\d*,\d*\)$", rgb_string)) or (
            is_normalized and re.match(r"^rgb\(\d*\.?\d*,\d*\.?\d*,\d*\.?\d*\)$", rgb_string)
        ):
            rgb_str_list = rgb_string[4:-1].split(",")
            if is_normalized:
                rgb_tuple = tuple(float(v) for v in rgb_str_list)
            else:
                rgb_tuple = tuple(int(v) for v in rgb_str_list)
            return cls._rgb_tuple_to_hex(rgb_tuple, is_normalized=is_normalized)
        raise ValueError(f"Invalid rgb color: '{rgb_string}'")

    @classmethod
    def _rgba_str_to_hex(
        cls,
        rgba_string: str,
        is_normalized: bool = False,
    ) -> str:
        """Convert an 'rgba(...)' string to a hex color."""
        if (not is_normalized and re.match(r"^rgba\(\d*,\d*,\d*,\d*\.?\d*\)$", rgba_string)) or (
            is_normalized
            and re.match(r"^rgba\(\d*\.?\d*,\d*\.?\d*,\d*\.?\d*,\d*\.?\d*\)$", rgba_string)
        ):
            rgba_str_list = rgba_string[5:-1].split(",")
            if float(rgba_str_list[-1]) > 1:
                raise ValueError(
                    f"Invalid alpha value (must be float between 0 and 1): '{rgba_string}'"
                )
            if is_normalized:
                rgba_tuple = tuple(float(v) for v in rgba_str_list)
            else:
                rgba_tuple = tuple(
                    int(v) if i < 3 else float(v) for i, v in enumerate(rgba_str_list)
                )
            return cls._rgba_tuple_to_hex(rgba_tuple, is_normalized=is_normalized)
        raise ValueError(f"Invalid rgba color: '{rgba_string}'")

    @classmethod
    def _rgb_tuple_to_hex(
        cls,
        rgb_tuple: Tuple[int, ...] | Tuple[float, ...],
        is_normalized: bool = False,
    ) -> str:
        """Convert an RGB tuple to a hex color string."""
        if is_normalized:
            rgb_tuple = tuple(int(v * 255) for v in rgb_tuple)
        is_all_int = all(isinstance(v, int | np.integer) for v in rgb_tuple)
        is_all_in_range = all(0 <= v <= 255 for v in rgb_tuple)
        if is_all_int and is_all_in_range:
            return "#{:02X}{:02X}{:02X}".format(*rgb_tuple)
        raise ValueError(f"Invalid rgb tuple: '{rgb_tuple}'")

    @classmethod
    def _rgba_tuple_to_hex(
        cls,
        rgba_tuple: Tuple[int | float, ...],
        is_normalized: bool = False,
    ) -> str:
        """Convert an RGBA tuple to a hex color string."""
        if is_normalized:
            rgba_tuple = tuple(int(v * 255) if i < 3 else v for i, v in enumerate(rgba_tuple))
        is_all_int = all(isinstance(v, int | np.integer | float | np.floating) for v in rgba_tuple)
        is_all_in_range = all(
            0 <= v <= 255 if i < 3 else 0 <= v <= 1 for i, v in enumerate(rgba_tuple)
        )
        if is_all_int and is_all_in_range:
            rgba_tuple = tuple(int(v) if i < 3 else float(v) for i, v in enumerate(rgba_tuple))
            rgba_int_tuple = tuple(
                int(v) if i < 3 else int(float(v) * 255) for i, v in enumerate(rgba_tuple)
            )
            return "#{:02X}{:02X}{:02X}{:02X}".format(*rgba_int_tuple)
        raise ValueError(f"Invalid rgba tuple: '{rgba_tuple}'")

    @classmethod
    def _hex_str_to_hex(
        cls,
        hex_string: str,
    ) -> str:
        """Normalize a hex string to standard 6- or 8-character format."""
        c = hex_string.upper()
        if re.match(r"^#[A-F0-9]{3}$", c):
            c = f"#{c[1] * 2}{c[2] * 2}{c[3] * 2}"
        elif re.match(r"^#[A-F0-9]{4}$", c):
            c = f"#{c[1] * 2}{c[2] * 2}{c[3] * 2}{c[4] * 2}"
        if not re.match(r"^#[A-F0-9]{6}$", c) and not re.match(r"^#[A-F0-9]{8}$", c):
            raise ValueError(f"Invalid hex color: '{hex_string}'")
        return c

    @classmethod
    def _to_hex(
        cls,
        color: str | Sequence,
        is_normalized: bool = False,
    ) -> str:
        """Convert a color input of various formats to a hex string."""
        if isinstance(color, str):
            c_str = color.strip().replace(" ", "").lower()
            if c_str.startswith("#"):
                return cls._hex_str_to_hex(c_str)
            elif c_str.startswith("rgb("):
                return cls._rgb_str_to_hex(c_str)
            elif c_str.startswith("rgba("):
                return cls._rgba_str_to_hex(c_str)
            elif c_str.startswith("rgb255("):
                return cls._rgb_str_to_hex(c_str.replace("rgb255(", "rgb("))
            elif c_str.startswith("rgba255("):
                return cls._rgba_str_to_hex(c_str.replace("rgba255(", "rgba("))
            elif c_str.startswith("rgb01("):
                return cls._rgb_str_to_hex(c_str.replace("rgb01(", "rgb("), is_normalized=True)
            elif c_str.startswith("rgba01("):
                return cls._rgba_str_to_hex(c_str.replace("rgba01(", "rgba("), is_normalized=True)
            else:
                try:
                    return EC_COLORS[color].upper()
                except KeyError:
                    pass
                return mcolors.to_hex(color).upper()
        elif isinstance(color, (Sequence, np.ndarray)):
            if len(color) > 0:
                if isinstance(color[0], float):
                    is_normalized = True
                else:
                    is_normalized = False
            c_tup = tuple(float(v) for v in color)
            if len(c_tup) == 3:
                if is_normalized:
                    c_tup = tuple(float(v) for v in color)
                else:
                    c_tup = tuple(int(v) for v in color)
                return cls._rgb_tuple_to_hex(c_tup, is_normalized=is_normalized)
            elif len(c_tup) == 4:
                return cls._rgba_tuple_to_hex(c_tup, is_normalized=is_normalized)
        raise TypeError(f"Invalid type for input color ({type(color)}: {color})")

    @property
    def hex(self) -> str:
        """Returns the hex color string."""
        return str(self).upper()

    @property
    def rgb(self) -> Tuple[int, int, int]:
        """Returns the RGB tuple with values in the 0-255 range."""
        hex_str = self.lstrip("#")
        return (
            int(hex_str[0:2], 16),
            int(hex_str[2:4], 16),
            int(hex_str[4:6], 16),
        )

    @property
    def alpha(self) -> float:
        """Returns the transparency alpha value in the 0-1 range."""
        if len(self) == 9:
            return int(str(self).upper()[7::], 16) / 255
        return 1.0

    @property
    def rgba(self) -> Tuple[float, float, float, float]:
        """Returns the RGBA tuple with values in the 0-1 range."""
        hex_str = self.lstrip("#")
        return (
            int(hex_str[0:2], 16) / 255,
            int(hex_str[2:4], 16) / 255,
            int(hex_str[4:6], 16) / 255,
            self.alpha,
        )

    def set_alpha(self, value: float) -> "Color":
        """Returns the same color with the given transparency alpha value applied."""
        if not 0 <= value <= 1:
            raise ValueError(f"Invalid alpha value: '{value}' (must be in the 0-1 range)")
        return Color(self.hex[0:7] + "{:02X}".format(int(value * 255)), name=self.name)

    def blend(self, value: float, blend_color: "Color" | ColorLike = "white") -> "Color":
        """Returns the same color blended with a second color."""
        original_color = self.rgb
        blend_color = Color(blend_color).rgb
        new_color = Color(
            tuple(
                int(round((1 - value) * bc + value * oc))
                for oc, bc in zip(original_color, blend_color)
            )
        )
        return new_color

    @classmethod
    def from_optional(
        cls,
        color_input: "Color" | ColorLike | None,
        alpha: float | None = None,
    ) -> Union["Color", None]:
        """Parses optional color input and returns a `Color` instance or `None`."""
        if color_input is None:
            return None
        elif isinstance(alpha, float):
            return cls(color_input).set_alpha(alpha)
        elif color_input == "none":
            return None
        return cls(color_input)

    def is_close_to_white(self, threshold: float = 0.1) -> bool:
        """Check if the color is close to white."""
        rgb01 = 1 - (np.array(self.rgb) / 255)
        return bool(np.all(rgb01 < threshold))

    def get_best_bw_contrast_color(self) -> "Color":
        """
        Return black or white color depending on best contrast according to WCAG 2.0.

        See https://www.w3.org/TR/WCAG20/
        """
        return Color(get_best_bw_contrast_color(self.rgb))

__hash__

__hash__()

Return the hash of the color string.

Source code in earthcarekit/color/_color.py
def __hash__(self):
    """Return the hash of the color string."""
    return hash(str(self))

__init__

__init__(color_input: Color | ColorLike, name: str | None = None, is_normalized: bool = False)

Initialize Color attributes.

Source code in earthcarekit/color/_color.py
def __init__(
    self,
    color_input: "Color" | ColorLike,
    name: str | None = None,
    is_normalized: bool = False,
):
    """Initialize Color attributes."""
    object.__setattr__(self, "input", color_input)
    object.__setattr__(self, "name", name)
    object.__setattr__(self, "is_normalized", is_normalized)

__new__

__new__(color_input: Color | ColorLike, name: str | None = None, is_normalized: bool = False)

Create a Color instance from a color-like input.

Source code in earthcarekit/color/_color.py
def __new__(
    cls,
    color_input: "Color" | ColorLike,
    name: str | None = None,
    is_normalized: bool = False,
):
    """Create a Color instance from a color-like input."""
    hex_color = cls._to_hex(color_input, is_normalized=is_normalized)
    return str.__new__(cls, hex_color)

alpha property

alpha: float

Returns the transparency alpha value in the 0-1 range.

blend

blend(value: float, blend_color: Color | ColorLike = 'white') -> Color

Returns the same color blended with a second color.

Source code in earthcarekit/color/_color.py
def blend(self, value: float, blend_color: "Color" | ColorLike = "white") -> "Color":
    """Returns the same color blended with a second color."""
    original_color = self.rgb
    blend_color = Color(blend_color).rgb
    new_color = Color(
        tuple(
            int(round((1 - value) * bc + value * oc))
            for oc, bc in zip(original_color, blend_color)
        )
    )
    return new_color

from_optional classmethod

from_optional(
    color_input: Color | ColorLike | None, alpha: float | None = None
) -> Union[Color, None]

Parses optional color input and returns a Color instance or None.

Source code in earthcarekit/color/_color.py
@classmethod
def from_optional(
    cls,
    color_input: "Color" | ColorLike | None,
    alpha: float | None = None,
) -> Union["Color", None]:
    """Parses optional color input and returns a `Color` instance or `None`."""
    if color_input is None:
        return None
    elif isinstance(alpha, float):
        return cls(color_input).set_alpha(alpha)
    elif color_input == "none":
        return None
    return cls(color_input)

get_best_bw_contrast_color

get_best_bw_contrast_color() -> Color

Return black or white color depending on best contrast according to WCAG 2.0.

See https://www.w3.org/TR/WCAG20/

Source code in earthcarekit/color/_color.py
def get_best_bw_contrast_color(self) -> "Color":
    """
    Return black or white color depending on best contrast according to WCAG 2.0.

    See https://www.w3.org/TR/WCAG20/
    """
    return Color(get_best_bw_contrast_color(self.rgb))

hex property

hex: str

Returns the hex color string.

is_close_to_white

is_close_to_white(threshold: float = 0.1) -> bool

Check if the color is close to white.

Source code in earthcarekit/color/_color.py
def is_close_to_white(self, threshold: float = 0.1) -> bool:
    """Check if the color is close to white."""
    rgb01 = 1 - (np.array(self.rgb) / 255)
    return bool(np.all(rgb01 < threshold))

rgb property

rgb: Tuple[int, int, int]

Returns the RGB tuple with values in the 0-255 range.

rgba property

rgba: Tuple[float, float, float, float]

Returns the RGBA tuple with values in the 0-1 range.

set_alpha

set_alpha(value: float) -> Color

Returns the same color with the given transparency alpha value applied.

Source code in earthcarekit/color/_color.py
def set_alpha(self, value: float) -> "Color":
    """Returns the same color with the given transparency alpha value applied."""
    if not 0 <= value <= 1:
        raise ValueError(f"Invalid alpha value: '{value}' (must be in the 0-1 range)")
    return Color(self.hex[0:7] + "{:02X}".format(int(value * 255)), name=self.name)

CurtainFigure

Bases: TimeseriesFigure

Figure object for displaying EarthCARE curtain data (e.g., ATLID and CPR L1/L2 profiles) along the satellite track.

This class sets up a horizontal-along-track or time vs. vertical-height plot (a "curtain" view), for profiling atmospheric quantities retrieved from ground-based or nadir-viewing air/space-bourne instruments (like EarthCARE). It displays dual top/bottom x-axes (e.g., geolocation and time), and left/right y-axes for height labels.

Attributes:

Name Type Description
ax Axes | None

Existing matplotlib axes to plot on; if not provided, a new figure and axes will be created. Defaults to None.

figsize tuple[float, float]

Size of the figure in inches. Defaults to (FIGURE_WIDTH_CURTAIN, FIGURE_HEIGHT_CURTAIN).

dpi int | None

Resolution of the figure in dots per inch. Defaults to None.

title str | None

Title to display above the curtain plot. Defaults to None.

ax_style_top AlongTrackAxisStyle | str

Style of the top x-axis, e.g., "geo", "time", or "frame". Defaults to "geo".

ax_style_bottom AlongTrackAxisStyle | str

Style of the bottom x-axis, e.g., "geo", "time", or "frame". Defaults to "time".

num_ticks int

Maximum number of tick marks to be place along the x-axis. Defaults to 10.

show_height_left bool

Whether to show height labels on the left y-axis. Defaults to True.

show_height_right bool

Whether to show height labels on the right y-axis. Defaults to False.

mode Literal['exact', 'fast']

Curtain plotting mode. Use "fast" to speed up plotting by coarsening data to at least min_num_profiles; "exact" plots full resolution. Defaults to None.

min_num_profiles int

Minimum number of profiles to keep when using "fast" mode. Defaults to 5000.

Source code in earthcarekit/plot/figure/curtain.py
 144
 145
 146
 147
 148
 149
 150
 151
 152
 153
 154
 155
 156
 157
 158
 159
 160
 161
 162
 163
 164
 165
 166
 167
 168
 169
 170
 171
 172
 173
 174
 175
 176
 177
 178
 179
 180
 181
 182
 183
 184
 185
 186
 187
 188
 189
 190
 191
 192
 193
 194
 195
 196
 197
 198
 199
 200
 201
 202
 203
 204
 205
 206
 207
 208
 209
 210
 211
 212
 213
 214
 215
 216
 217
 218
 219
 220
 221
 222
 223
 224
 225
 226
 227
 228
 229
 230
 231
 232
 233
 234
 235
 236
 237
 238
 239
 240
 241
 242
 243
 244
 245
 246
 247
 248
 249
 250
 251
 252
 253
 254
 255
 256
 257
 258
 259
 260
 261
 262
 263
 264
 265
 266
 267
 268
 269
 270
 271
 272
 273
 274
 275
 276
 277
 278
 279
 280
 281
 282
 283
 284
 285
 286
 287
 288
 289
 290
 291
 292
 293
 294
 295
 296
 297
 298
 299
 300
 301
 302
 303
 304
 305
 306
 307
 308
 309
 310
 311
 312
 313
 314
 315
 316
 317
 318
 319
 320
 321
 322
 323
 324
 325
 326
 327
 328
 329
 330
 331
 332
 333
 334
 335
 336
 337
 338
 339
 340
 341
 342
 343
 344
 345
 346
 347
 348
 349
 350
 351
 352
 353
 354
 355
 356
 357
 358
 359
 360
 361
 362
 363
 364
 365
 366
 367
 368
 369
 370
 371
 372
 373
 374
 375
 376
 377
 378
 379
 380
 381
 382
 383
 384
 385
 386
 387
 388
 389
 390
 391
 392
 393
 394
 395
 396
 397
 398
 399
 400
 401
 402
 403
 404
 405
 406
 407
 408
 409
 410
 411
 412
 413
 414
 415
 416
 417
 418
 419
 420
 421
 422
 423
 424
 425
 426
 427
 428
 429
 430
 431
 432
 433
 434
 435
 436
 437
 438
 439
 440
 441
 442
 443
 444
 445
 446
 447
 448
 449
 450
 451
 452
 453
 454
 455
 456
 457
 458
 459
 460
 461
 462
 463
 464
 465
 466
 467
 468
 469
 470
 471
 472
 473
 474
 475
 476
 477
 478
 479
 480
 481
 482
 483
 484
 485
 486
 487
 488
 489
 490
 491
 492
 493
 494
 495
 496
 497
 498
 499
 500
 501
 502
 503
 504
 505
 506
 507
 508
 509
 510
 511
 512
 513
 514
 515
 516
 517
 518
 519
 520
 521
 522
 523
 524
 525
 526
 527
 528
 529
 530
 531
 532
 533
 534
 535
 536
 537
 538
 539
 540
 541
 542
 543
 544
 545
 546
 547
 548
 549
 550
 551
 552
 553
 554
 555
 556
 557
 558
 559
 560
 561
 562
 563
 564
 565
 566
 567
 568
 569
 570
 571
 572
 573
 574
 575
 576
 577
 578
 579
 580
 581
 582
 583
 584
 585
 586
 587
 588
 589
 590
 591
 592
 593
 594
 595
 596
 597
 598
 599
 600
 601
 602
 603
 604
 605
 606
 607
 608
 609
 610
 611
 612
 613
 614
 615
 616
 617
 618
 619
 620
 621
 622
 623
 624
 625
 626
 627
 628
 629
 630
 631
 632
 633
 634
 635
 636
 637
 638
 639
 640
 641
 642
 643
 644
 645
 646
 647
 648
 649
 650
 651
 652
 653
 654
 655
 656
 657
 658
 659
 660
 661
 662
 663
 664
 665
 666
 667
 668
 669
 670
 671
 672
 673
 674
 675
 676
 677
 678
 679
 680
 681
 682
 683
 684
 685
 686
 687
 688
 689
 690
 691
 692
 693
 694
 695
 696
 697
 698
 699
 700
 701
 702
 703
 704
 705
 706
 707
 708
 709
 710
 711
 712
 713
 714
 715
 716
 717
 718
 719
 720
 721
 722
 723
 724
 725
 726
 727
 728
 729
 730
 731
 732
 733
 734
 735
 736
 737
 738
 739
 740
 741
 742
 743
 744
 745
 746
 747
 748
 749
 750
 751
 752
 753
 754
 755
 756
 757
 758
 759
 760
 761
 762
 763
 764
 765
 766
 767
 768
 769
 770
 771
 772
 773
 774
 775
 776
 777
 778
 779
 780
 781
 782
 783
 784
 785
 786
 787
 788
 789
 790
 791
 792
 793
 794
 795
 796
 797
 798
 799
 800
 801
 802
 803
 804
 805
 806
 807
 808
 809
 810
 811
 812
 813
 814
 815
 816
 817
 818
 819
 820
 821
 822
 823
 824
 825
 826
 827
 828
 829
 830
 831
 832
 833
 834
 835
 836
 837
 838
 839
 840
 841
 842
 843
 844
 845
 846
 847
 848
 849
 850
 851
 852
 853
 854
 855
 856
 857
 858
 859
 860
 861
 862
 863
 864
 865
 866
 867
 868
 869
 870
 871
 872
 873
 874
 875
 876
 877
 878
 879
 880
 881
 882
 883
 884
 885
 886
 887
 888
 889
 890
 891
 892
 893
 894
 895
 896
 897
 898
 899
 900
 901
 902
 903
 904
 905
 906
 907
 908
 909
 910
 911
 912
 913
 914
 915
 916
 917
 918
 919
 920
 921
 922
 923
 924
 925
 926
 927
 928
 929
 930
 931
 932
 933
 934
 935
 936
 937
 938
 939
 940
 941
 942
 943
 944
 945
 946
 947
 948
 949
 950
 951
 952
 953
 954
 955
 956
 957
 958
 959
 960
 961
 962
 963
 964
 965
 966
 967
 968
 969
 970
 971
 972
 973
 974
 975
 976
 977
 978
 979
 980
 981
 982
 983
 984
 985
 986
 987
 988
 989
 990
 991
 992
 993
 994
 995
 996
 997
 998
 999
1000
1001
1002
1003
1004
1005
1006
1007
1008
1009
1010
1011
1012
1013
1014
1015
1016
1017
1018
1019
1020
1021
1022
1023
1024
1025
1026
1027
1028
1029
1030
1031
1032
1033
1034
1035
1036
1037
1038
1039
1040
1041
1042
1043
1044
1045
1046
1047
1048
1049
1050
1051
1052
1053
1054
1055
1056
1057
1058
1059
1060
1061
1062
1063
1064
1065
1066
1067
1068
1069
1070
1071
1072
1073
1074
1075
1076
1077
1078
1079
1080
1081
1082
1083
1084
1085
1086
1087
1088
1089
1090
1091
1092
1093
1094
1095
1096
1097
1098
1099
1100
1101
1102
1103
1104
1105
1106
1107
1108
1109
1110
1111
1112
1113
1114
1115
1116
1117
1118
1119
1120
1121
1122
1123
1124
1125
1126
1127
1128
1129
1130
1131
1132
1133
1134
1135
1136
1137
1138
1139
1140
1141
1142
1143
1144
1145
1146
1147
1148
1149
1150
1151
1152
1153
1154
1155
1156
1157
1158
1159
1160
1161
1162
1163
1164
1165
1166
1167
1168
1169
1170
1171
1172
1173
1174
1175
1176
1177
1178
1179
1180
1181
1182
1183
1184
1185
1186
1187
1188
1189
1190
1191
1192
1193
1194
1195
1196
1197
1198
1199
1200
1201
1202
1203
1204
1205
1206
1207
1208
1209
1210
1211
1212
1213
1214
1215
1216
1217
1218
1219
1220
class CurtainFigure(TimeseriesFigure):
    """Figure object for displaying EarthCARE curtain data (e.g., ATLID and CPR L1/L2 profiles) along the satellite track.

    This class sets up a horizontal-along-track or time vs. vertical-height plot (a "curtain" view), for profiling
    atmospheric quantities retrieved from ground-based or nadir-viewing air/space-bourne instruments (like EarthCARE).
    It displays dual top/bottom x-axes (e.g., geolocation and time), and left/right y-axes for height labels.

    Attributes:
        ax (Axes | None, optional): Existing matplotlib axes to plot on; if not provided, a new figure and axes will be created. Defaults to None.
        figsize (tuple[float, float], optional): Size of the figure in inches. Defaults to (FIGURE_WIDTH_CURTAIN, FIGURE_HEIGHT_CURTAIN).
        dpi (int | None, optional): Resolution of the figure in dots per inch. Defaults to None.
        title (str | None, optional): Title to display above the curtain plot. Defaults to None.
        ax_style_top (AlongTrackAxisStyle | str, optional): Style of the top x-axis, e.g., "geo", "time", or "frame". Defaults to "geo".
        ax_style_bottom (AlongTrackAxisStyle | str, optional): Style of the bottom x-axis, e.g., "geo", "time", or "frame". Defaults to "time".
        num_ticks (int, optional): Maximum number of tick marks to be place along the x-axis. Defaults to 10.
        show_height_left (bool, optional): Whether to show height labels on the left y-axis. Defaults to True.
        show_height_right (bool, optional): Whether to show height labels on the right y-axis. Defaults to False.
        mode (Literal["exact", "fast"], optional): Curtain plotting mode. Use "fast" to speed up plotting by coarsening data to at least `min_num_profiles`; "exact" plots full resolution. Defaults to None.
        min_num_profiles (int, optional): Minimum number of profiles to keep when using "fast" mode. Defaults to 5000.
    """

    def __init__(
        self: Self,
        ax: Axes | None = None,
        fig: Figure | None = None,
        figsize: tuple[float, float] = (FIGURE_WIDTH_CURTAIN, FIGURE_HEIGHT_CURTAIN),
        dpi: float | None = None,
        title: str | None = None,
        fig_height_scale: float = 1.0,
        fig_width_scale: float = 1.0,
        axes_rect: tuple[float, float, float, float] = (0.0, 0.0, 1.0, 1.0),
        show_grid: bool | None = False,
        grid_kwargs: dict[str, Any] = {},
        title_kwargs: dict[str, Any] = {},
        # base
        num_ticks: int = 10,
        ax_style_top: AlongTrackAxisStyle | str = "geo",
        ax_style_bottom: AlongTrackAxisStyle | str = "time",
        ax_style_y: Literal["height"] | None = "height",
        show_y_right: bool = False,
        show_y_left: bool = True,
        # timeseries
        show_height_left: bool = True,
        show_height_right: bool = False,
        mode: Literal["exact", "fast"] = "fast",
        min_num_profiles: int = _MIN_NUM_PROFILES,
        colorbar_tick_scale: float | None = None,
    ) -> None:
        super().__init__(
            ax=ax,
            fig=fig,
            figsize=figsize,
            dpi=dpi,
            title=title,
            fig_height_scale=fig_height_scale,
            fig_width_scale=fig_width_scale,
            axes_rect=axes_rect,
            show_grid=show_grid,
            grid_kwargs=grid_kwargs,
            title_kwargs=title_kwargs,
            num_ticks=num_ticks,
            ax_style_top=ax_style_top,
            ax_style_bottom=ax_style_bottom,
            ax_style_y=ax_style_y,
            show_y_right=show_y_right,
            show_y_left=show_y_left,
        )

        self.colorbar_tick_scale: float | None = colorbar_tick_scale

        self.info_text: AnchoredText | None = None
        self.info_text_loc: str = "upper right"
        self.show_height_left = show_height_left
        self.show_height_right = show_height_right

        if mode in ["exact", "fast"]:
            self.mode = mode
        else:
            self.mode = "fast"

        if isinstance(min_num_profiles, int):
            self.min_num_profiles = min_num_profiles
        else:
            self.min_num_profiles = _MIN_NUM_PROFILES

    def _set_info_text_loc(self: Self, info_text_loc: str | None) -> None:
        if isinstance(info_text_loc, str):
            self.info_text_loc = info_text_loc

    def _set_axes(
        self: Self,
        tmin: np.datetime64,
        tmax: np.datetime64,
        hmin: float,
        hmax: float,
        time: NDArray,
        tmin_original: np.datetime64 | None = None,
        tmax_original: np.datetime64 | None = None,
        longitude: NDArray | None = None,
        latitude: NDArray | None = None,
        ax_style_top: AlongTrackAxisStyle | str | None = None,
        ax_style_bottom: AlongTrackAxisStyle | str | None = None,
    ) -> Self:

        self.set_colorbar_tick_scale(multiplier=self.colorbar_tick_scale)

        self._set_y_axes(hmin, hmax)

        self._set_time_axes(
            tmin=tmin,
            tmax=tmax,
            time=time,
            tmin_original=tmin_original,
            tmax_original=tmax_original,
            longitude=longitude,
            latitude=latitude,
            ax_style_top=ax_style_top,
            ax_style_bottom=ax_style_bottom,
        )

        return self

    def plot(
        self: Self,
        profiles: Profile | None = None,
        *,
        values: NDArray | None = None,
        time: NDArray | None = None,
        height: NDArray | None = None,
        latitude: NDArray | None = None,
        longitude: NDArray | None = None,
        values_temperature: NDArray | None = None,
        # Common args for wrappers
        value_range: ValueRangeLike | None = None,
        log_scale: bool | None = None,
        norm: Normalize | None = None,
        time_range: TimeRangeLike | None = None,
        height_range: DistanceRangeLike | None = (0, 40e3),
        label: str | None = None,
        units: str | None = None,
        cmap: str | Colormap | None = None,
        colorbar: bool = True,
        colorbar_ticks: ArrayLike | None = None,
        colorbar_tick_labels: ArrayLike | None = None,
        colorbar_position: str | Literal["left", "right", "top", "bottom"] = "right",
        colorbar_alignment: str | Literal["left", "center", "right"] = "center",
        colorbar_width: float = DEFAULT_COLORBAR_WIDTH,
        colorbar_spacing: float = 0.2,
        colorbar_length_ratio: float | str = "100%",
        colorbar_label_outside: bool = True,
        colorbar_ticks_outside: bool = True,
        colorbar_ticks_both: bool = False,
        rolling_mean: int | None = None,
        selection_time_range: TimeRangeLike | None = None,
        selection_color: str | None = Color("ec:earthcare"),
        selection_linestyle: str | None = "dashed",
        selection_linewidth: float | int | None = 2.5,
        selection_highlight: bool = False,
        selection_highlight_inverted: bool = True,
        selection_highlight_color: str | None = Color("white"),
        selection_highlight_alpha: float = 0.5,
        selection_max_time_margin: (TimedeltaLike | Sequence[TimedeltaLike] | None) = None,
        ax_style_top: AlongTrackAxisStyle | str | None = None,
        ax_style_bottom: AlongTrackAxisStyle | str | None = None,
        show_temperature: bool = False,
        mode: Literal["exact", "fast"] | None = None,
        min_num_profiles: int = _MIN_NUM_PROFILES,
        mark_time: TimestampLike | Sequence[TimestampLike] | None = None,
        mark_time_color: (str | Color | Sequence[str | Color | None] | None) = None,
        mark_time_linestyle: str | Sequence[str] = "solid",
        mark_time_linewidth: float | Sequence[float] = 2.5,
        label_length: int = 40,
        **kwargs: Any,
    ) -> Self:
        self._update(
            selection_color=selection_color,
            selection_linestyle=selection_linestyle,
            selection_linewidth=selection_linewidth,
            selection_highlight=selection_highlight,
            selection_highlight_inverted=selection_highlight_inverted,
            selection_highlight_color=selection_highlight_color,
            selection_highlight_alpha=selection_highlight_alpha,
            mark_time=mark_time,
            mark_time_color=mark_time_color,
            mark_time_linestyle=mark_time_linestyle,
            mark_time_linewidth=mark_time_linewidth,
        )

        if mode in ["exact", "fast"]:
            self.mode = mode

        if isinstance(min_num_profiles, int):
            self.min_num_profiles = min_num_profiles

        cmap = get_cmap(cmap)
        self._set_norm(
            norm=norm,
            value_range=value_range,
            log_scale=log_scale,
            cmap=cmap,
        )

        if isinstance(profiles, Profile):
            values = profiles.values
            time = profiles.time
            height = profiles.height
            latitude = profiles.latitude
            longitude = profiles.longitude
            label = profiles.label
            units = profiles.units
        elif values is None or time is None or height is None:
            raise ValueError(
                "Missing required arguments. Provide either a `VerticalProfiles` or all of `values`, `time`, and `height`"
            )

        values = np.asarray(values)
        time = np.asarray(time)
        height = np.asarray(height)
        latitude = asarray_or_none(latitude)
        longitude = asarray_or_none(longitude)

        vp = Profile(
            values=values,
            time=time,
            height=height,
            latitude=latitude,
            longitude=longitude,
            label=label,
            units=units,
        )

        tmin_original: np.datetime64 = vp.time[0]
        tmax_original: np.datetime64 = vp.time[-1]

        if isinstance(rolling_mean, int):
            vp = vp.rolling_mean(rolling_mean)

        self._set_selection_max_time_margin(selection_max_time_margin)
        self._set_selection_time_range(selection_time_range)
        time_range = self._get_time_range(time=vp.time, time_range=time_range)
        height_range = self._get_y_range(y=vp.height, y_range=height_range)

        vp = vp.select_height_range(height_range=height_range, pad_idx=1)
        vp = vp.select_time_range(time_range=time_range, pad_idxs=rolling_mean or 0)

        self._tmin, self._tmax = time_range
        self._ymin, self._ymax = height_range

        time_non_coarsened = vp.time
        lat_non_coarsened = vp.latitude
        lon_non_coarsened = vp.longitude

        if (
            self.mode == "fast"
            and not cmap.categorical
            and not np.issubdtype(vp.values.dtype, np.integer)
        ):
            n = vp.time.shape[0] // self.min_num_profiles
            if n > 1:
                vp = vp.coarsen_mean(n)

        time_grid, height_grid = create_time_height_grids(
            values=vp.values, time=vp.time, height=vp.height
        )

        mesh = self._ax.pcolormesh(
            time_grid,
            height_grid[:, ::-1],
            vp.values[:, ::-1],
            cmap=cmap,
            norm=self._norm,
            shading="auto",
            linewidth=0,
            rasterized=True,
            **kwargs,
        )
        mesh.set_edgecolor("face")

        if colorbar:
            cb_kwargs = dict(
                label=format_var_label(vp.label, vp.units, label_len=label_length),
                position=colorbar_position,
                alignment=colorbar_alignment,
                width=colorbar_width,
                spacing=colorbar_spacing,
                length_ratio=colorbar_length_ratio,
                label_outside=colorbar_label_outside,
                ticks_outside=colorbar_ticks_outside,
                ticks_both=colorbar_ticks_both,
            )
            if cmap.categorical:
                self.set_colorbar(
                    data=mesh,
                    cmap=cmap,
                    **cb_kwargs,  # type: ignore
                )
            else:
                self.set_colorbar(
                    data=mesh,
                    ticks=colorbar_ticks,
                    tick_labels=colorbar_tick_labels,
                    **cb_kwargs,  # type: ignore
                )

        _latitude = None
        if isinstance(vp.latitude, (np.ndarray)) and isinstance(lat_non_coarsened, (np.ndarray)):
            _latitude = np.concatenate(
                ([lat_non_coarsened[0]], vp.latitude, [lat_non_coarsened[-1]])
            )

        _longitude = None
        if isinstance(vp.longitude, (np.ndarray)) and isinstance(lon_non_coarsened, (np.ndarray)):
            _longitude = np.concatenate(
                ([lon_non_coarsened[0]], vp.longitude, [lon_non_coarsened[-1]])
            )

        self._set_axes(
            tmin=self._tmin,
            tmax=self._tmax,
            hmin=self._ymin,
            hmax=self._ymax,
            time=np.concatenate(([time_non_coarsened[0]], vp.time, [time_non_coarsened[-1]])),
            tmin_original=tmin_original,
            tmax_original=tmax_original,
            latitude=_latitude,
            longitude=_longitude,
            ax_style_top=ax_style_top,
            ax_style_bottom=ax_style_bottom,
        )

        if show_temperature and values_temperature is not None:
            self.plot_contour(
                values=values_temperature,
                time=time,
                height=height,
            )

        self._plot_selection()
        self._plot_time_marks()

        return self

    def ecplot(
        self: Self,
        ds: xr.Dataset,
        var: str,
        *,
        time_var: str = TIME_VAR,
        height_var: str = HEIGHT_VAR,
        lat_var: str = TRACK_LAT_VAR,
        lon_var: str = TRACK_LON_VAR,
        temperature_var: str = TEMP_CELSIUS_VAR,
        along_track_dim: str = ALONG_TRACK_DIM,
        site: SiteLike | None = None,
        radius_km: float = 100.0,
        mark_closest: bool = False,
        show_radius: bool = True,
        show_info: bool = True,
        show_info_orbit_and_frame: bool = True,
        show_info_file_type: bool = True,
        show_info_baseline: bool = True,
        info_text_orbit_and_frame: str | None = None,
        info_text_file_type: str | None = None,
        info_text_baseline: str | None = None,
        info_text_loc: str | None = None,
        # Common args for wrappers
        values: NDArray | None = None,
        time: NDArray | None = None,
        height: NDArray | None = None,
        latitude: NDArray | None = None,
        longitude: NDArray | None = None,
        values_temperature: NDArray | None = None,
        value_range: ValueRangeLike | Literal["default"] | None = "default",
        log_scale: bool | None = None,
        norm: Normalize | None = None,
        time_range: TimeRangeLike | None = None,
        height_range: DistanceRangeLike | None = (0, 40e3),
        label: str | None = None,
        units: str | None = None,
        cmap: str | Colormap | None = None,
        colorbar: bool = True,
        colorbar_ticks: ArrayLike | None = None,
        colorbar_tick_labels: ArrayLike | None = None,
        colorbar_position: str | Literal["left", "right", "top", "bottom"] = "right",
        colorbar_alignment: str | Literal["left", "center", "right"] = "center",
        colorbar_width: float = DEFAULT_COLORBAR_WIDTH,
        colorbar_spacing: float = 0.2,
        colorbar_length_ratio: float | str = "100%",
        colorbar_label_outside: bool = True,
        colorbar_ticks_outside: bool = True,
        colorbar_ticks_both: bool = False,
        rolling_mean: int | None = None,
        selection_time_range: TimeRangeLike | None = None,
        selection_color: str | None = Color("ec:earthcare"),
        selection_linestyle: str | None = "dashed",
        selection_linewidth: float | int | None = 2.5,
        selection_highlight: bool = False,
        selection_highlight_inverted: bool = True,
        selection_highlight_color: str | None = Color("white"),
        selection_highlight_alpha: float = 0.5,
        selection_max_time_margin: (TimedeltaLike | Sequence[TimedeltaLike] | None) = None,
        ax_style_top: AlongTrackAxisStyle | str | None = None,
        ax_style_bottom: AlongTrackAxisStyle | str | None = None,
        show_temperature: bool = False,
        mode: Literal["exact", "fast"] | None = None,
        min_num_profiles: int = _MIN_NUM_PROFILES,
        mark_time: TimestampLike | Sequence[TimestampLike] | None = None,
        mark_time_color: (str | Color | Sequence[str | Color | None] | None) = None,
        mark_time_linestyle: str | Sequence[str] = "solid",
        mark_time_linewidth: float | Sequence[float] = 2.5,
        label_length: int = 40,
        **kwargs: Any,
    ) -> Self:
        """Plot a vertical curtain (i.e. cross-section) of a variable along the satellite track a EarthCARE dataset.

        This method collections all required data from a EarthCARE `xarray.dataset`, such as time, height, latitude and longitude.
        It supports various forms of customization through the use of arguments listed below.

        Args:
            ds (xr.Dataset): The EarthCARE dataset from with data will be plotted.
            var (str): Name of the variable to plot.
            time_var (str, optional): Name of the time variable. Defaults to TIME_VAR.
            height_var (str, optional): Name of the height variable. Defaults to HEIGHT_VAR.
            lat_var (str, optional): Name of the latitude variable. Defaults to TRACK_LAT_VAR.
            lon_var (str, optional): Name of the longitude variable. Defaults to TRACK_LON_VAR.
            temperature_var (str, optional): Name of the temperature variable; ignored if `show_temperature` is set to False. Defaults to TEMP_CELSIUS_VAR.
            along_track_dim (str, optional): Dimension name representing the along-track direction. Defaults to ALONG_TRACK_DIM.
            values (NDArray | None, optional): Data values to be used instead of values found in the `var` variable of the dataset. Defaults to None.
            time (NDArray | None, optional): Time values to be used instead of values found in the `time_var` variable of the dataset. Defaults to None.
            height (NDArray | None, optional): Height values to be used instead of values found in the `height_var` variable of the dataset. Defaults to None.
            latitude (NDArray | None, optional): Latitude values to be used instead of values found in the `lat_var` variable of the dataset. Defaults to None.
            longitude (NDArray | None, optional): Longitude values to be used instead of values found in the `lon_var` variable of the dataset. Defaults to None.
            values_temperature (NDArray | None, optional): Temperature values to be used instead of values found in the `temperature_var` variable of the dataset. Defaults to None.
            site (SiteLike | None, optional): Highlights data within `radius_km` of a ground site (given either as a `Site` object or name string); ignored if not set. Defaults to None.
            radius_km (float, optional): Radius around the ground site to highlight data from; ignored if `site` not set. Defaults to 100.0.
            mark_closest (bool, optional): Mark the closest profile to the ground site in the plot; ignored if `site` not set. Defaults to False.
            show_info (bool, optional): If True, show text on the plot containing EarthCARE frame and baseline info. Defaults to True.
            info_text_loc (str | None, optional): Place info text at a specific location of the plot, e.g. "upper right" or "lower left". Defaults to None.
            value_range (ValueRangeLike | None, optional): Min and max range for the variable values. Defaults to None.
            log_scale (bool | None, optional): Whether to apply a logarithmic color scale. Defaults to None.
            norm (Normalize | None, optional): Matplotlib norm to use for color scaling. Defaults to None.
            time_range (TimeRangeLike | None, optional): Time range to restrict the data for plotting. Defaults to None.
            height_range (DistanceRangeLike | None, optional): Height range to restrict the data for plotting. Defaults to (0, 40e3).
            label (str | None, optional): Label to use for colorbar. Defaults to None.
            units (str | None, optional): Units of the variable to show in the colorbar label. Defaults to None.
            cmap (str | Colormap | None, optional): Colormap to use for plotting. Defaults to None.
            colorbar (bool, optional): Whether to display a colorbar. Defaults to True.
            colorbar_ticks (ArrayLike | None, optional): Custom tick values for the colorbar. Defaults to None.
            colorbar_tick_labels (ArrayLike | None, optional): Custom labels for the colorbar ticks. Defaults to None.
            rolling_mean (int | None, optional): Apply rolling mean along time axis with this window size. Defaults to None.
            selection_time_range (TimeRangeLike | None, optional): Time range to highlight as a selection; ignored if `site` is set. Defaults to None.
            selection_color (_type_, optional): Color for the selection range marker lines. Defaults to Color("ec:earthcare").
            selection_linestyle (str | None, optional): Line style for selection range markers. Defaults to "dashed".
            selection_linewidth (float | int | None, optional): Line width for selection range markers. Defaults to 2.5.
            selection_highlight (bool, optional): Whether to highlight the selection region by shading outside or inside areas. Defaults to False.
            selection_highlight_inverted (bool, optional): If True and `selection_highlight` is also set to True, areas outside the selection are shaded. Defaults to True.
            selection_highlight_color (str | None, optional): If True and `selection_highlight` is also set to True, sets color used for shading selected outside or inside areas. Defaults to Color("white").
            selection_highlight_alpha (float, optional): If True and `selection_highlight` is also set to True, sets transparency used for shading selected outside or inside areas.. Defaults to 0.5.
            selection_max_time_margin (TimedeltaLike | Sequence[TimedeltaLike], optional): Zooms the time axis to a given maximum time from a selected time area. Defaults to None.
            ax_style_top (AlongTrackAxisStyle | str | None, optional): Style for the top axis (e.g., geo, lat, lon, distance, time, utc, lst, none). Defaults to None.
            ax_style_bottom (AlongTrackAxisStyle | str | None, optional): Style for the bottom axis (e.g., geo, lat, lon, distance, time, utc, lst, none). Defaults to None.
            show_temperature (bool, optional): Whether to overlay temperature as contours; requires either `values_temperature` or `temperature_var`. Defaults to False.
            mode (Literal["exact", "fast"] | None, optional): Overwrites the curtain plotting mode. Use "fast" to speed up plotting by coarsening data to at least `min_num_profiles`; "exact" plots full resolution. Defaults to None.
            min_num_profiles (int, optional): Overwrites the minimum number of profiles to keep when using "fast" mode. Defaults to 5000.
            mark_time (Sequence[TimestampLike] | None, optional): Timestamps at which to mark vertical profiles. Defaults to None.

        Returns:
            CurtainFigure: The figure object containing the curtain plot.

        Example:
            ```python
            import earthcarekit as eck

            filepath = (
                "path/to/mydata/ECA_EXAE_ATL_NOM_1B_20250606T132535Z_20250606T150730Z_05813D.h5"
            )
            with eck.read_product(filepath) as ds:
                cf = eck.CurtainFigure()
                cf = cf.ecplot(ds, "mie_attenuated_backscatter", height_range=(0, 20e3))
            ```
        """

        # Collect all common args for wrapped plot function call
        local_args = locals()

        # Handle deprecated arguments
        def _get_depr_arg(old_name: str, new_name: str) -> Any:
            if old_name in kwargs:
                msg = f"'{old_name}' is deprecated and will be removed in future versions; use '{new_name}' instead."
                warnings.warn(msg, FutureWarning, stacklevel=2)
                out = kwargs.get(old_name, local_args[new_name])
                del kwargs[old_name]
                return out
            return local_args[new_name]

        mark_closest = _get_depr_arg("mark_closest_profile", "mark_closest")
        kwargs["mark_time"] = _get_depr_arg("mark_profiles_at", "mark_time")
        kwargs["mark_time_color"] = _get_depr_arg("mark_profiles_at_color", "mark_time_color")
        kwargs["mark_time_linestyle"] = _get_depr_arg(
            "mark_profiles_at_linestyle", "mark_time_linestyle"
        )
        kwargs["mark_time_linewidth"] = _get_depr_arg(
            "mark_profiles_at_linewidth", "mark_time_linewidth"
        )

        # Delete all args specific to this wrapper function
        del local_args["self"]
        del local_args["ds"]
        del local_args["var"]
        del local_args["time_var"]
        del local_args["height_var"]
        del local_args["lat_var"]
        del local_args["lon_var"]
        del local_args["temperature_var"]
        del local_args["along_track_dim"]
        del local_args["site"]
        del local_args["radius_km"]
        del local_args["show_info"]
        del local_args["show_info_orbit_and_frame"]
        del local_args["show_info_file_type"]
        del local_args["show_info_baseline"]
        del local_args["info_text_orbit_and_frame"]
        del local_args["info_text_file_type"]
        del local_args["info_text_baseline"]
        del local_args["show_radius"]
        del local_args["info_text_loc"]
        del local_args["mark_closest"]

        # Delete kwargs to then merge it with the residual common args
        del local_args["kwargs"]
        all_args = {**local_args, **kwargs}

        warn_about_variable_limitations(var)

        if all_args["values"] is None:
            all_args["values"] = ds[var].values
        if all_args["time"] is None:
            all_args["time"] = ds[time_var].values
        if all_args["height"] is None:
            all_args["height"] = ds[height_var].values
        if all_args["latitude"] is None:
            all_args["latitude"] = ds[lat_var].values if lat_var in ds else None
        if all_args["longitude"] is None:
            all_args["longitude"] = ds[lon_var].values if lon_var in ds else None
        if all_args["values_temperature"] is None:
            if not show_temperature:
                all_args["values_temperature"] = None
            elif ds.get(temperature_var, None) is None:
                warnings.warn(
                    f'No temperature variable called "{temperature_var}" found in given dataset.'
                )
                all_args["values_temperature"] = None
            else:
                all_args["values_temperature"] = ds[temperature_var].values

        # Set default values depending on variable name
        if label is None:
            all_args["label"] = "Values" if not hasattr(ds[var], "long_name") else ds[var].long_name
        if units is None:
            all_args["units"] = "-" if not hasattr(ds[var], "units") else ds[var].units
        if isinstance(value_range, str) and value_range == "default":
            value_range = None
            all_args["value_range"] = None
            if norm is None:
                all_args["norm"] = get_default_norm(var, file_type=ds)
        if rolling_mean is None:
            all_args["rolling_mean"] = get_default_rolling_mean(var, file_type=ds)
        if cmap is None:
            all_args["cmap"] = get_default_cmap(var, file_type=ds)
        all_args["cmap"] = get_cmap(all_args["cmap"])

        if all_args["cmap"] == get_cmap("synergetic_tc"):
            self.colorbar_tick_scale = 0.8

        # Handle overpass
        all_args = self._add_overpass_marks(
            all_args=all_args,
            ds=ds,
            time_var=time_var,
            lat_var=lat_var,
            lon_var=lon_var,
            along_track_dim=along_track_dim,
            site=site,
            radius_km=radius_km,
            mark_closest=mark_closest,
            show_radius=show_radius,
        )

        self.plot(**all_args)

        self._set_info_text_loc(info_text_loc)
        if show_info:
            self.info_text = add_text_product_info(
                self._ax,
                ds,
                append_to=self.info_text,
                loc=self.info_text_loc,
                show_orbit_and_frame=show_info_orbit_and_frame,
                show_file_type=show_info_file_type,
                show_baseline=show_info_baseline,
                text_orbit_and_frame=info_text_orbit_and_frame,
                text_file_type=info_text_file_type,
                text_baseline=info_text_baseline,
            )

        return self

    def plot_height(
        self: Self,
        height: NDArray,
        time: NDArray,
        linewidth: int | float | None = 1.5,
        linestyle: str | None = "solid",
        color: Color | str | None = None,
        alpha: float | None = 1.0,
        zorder: int | float | None = _ZORDER,
        marker: str | None = None,
        markersize: int | float | None = None,
        fill: bool = False,
        legend_label: str | None = None,
        **kwargs: Any,
    ) -> Self:
        """Adds height line to the plot."""
        color = Color.from_optional(color)

        height = np.asarray(height)
        time = np.asarray(time)

        hnew, tnew = _convert_height_line_to_time_bin_step_function(height, time)

        fb: list = []
        if fill:
            _fb1 = self._ax.fill_between(
                tnew,
                hnew,
                y2=-5e3,
                color=color,
                alpha=alpha,
                zorder=zorder,
            )

            # Proxy for the legend
            _fb2 = Patch(facecolor=color, alpha=alpha, linewidth=0.0)
            fb = [_fb1, _fb2]

        hl = self._ax.plot(
            tnew,
            hnew,
            linestyle=linestyle,
            linewidth=linewidth,
            marker=marker,
            markersize=markersize,
            color=color,
            alpha=alpha,
            zorder=zorder,
            **kwargs,
        )

        if isinstance(legend_label, str):
            self._legend_handles.append(tuple(hl + fb))
            self._legend_labels.append(legend_label)

        return self

    def ecplot_height(
        self: Self,
        ds: xr.Dataset,
        var: str,
        time_var: str = TIME_VAR,
        linewidth: int | float | None = 1.5,
        linestyle: str | None = "none",
        color: Color | str | None = "black",
        zorder: int | float | None = _ZORDER,
        marker: str | None = "s",
        markersize: int | float | None = 1,
        show_info: bool = True,
        info_text_loc: str | None = None,
        legend_label: str | None = None,
    ) -> Self:
        """Adds height line to the plot."""
        height = ds[var].values
        time = ds[time_var].values
        self.plot_height(
            height=height,
            time=time,
            linewidth=linewidth,
            linestyle=linestyle,
            color=color,
            zorder=zorder,
            marker=marker,
            markersize=markersize,
            legend_label=legend_label,
        )

        self._set_info_text_loc(info_text_loc)
        if show_info:
            self.info_text = add_text_product_info(
                self._ax, ds, append_to=self.info_text, loc=self.info_text_loc
            )

        return self

    def plot_contour(
        self: Self,
        values: NDArray,
        time: NDArray,
        height: NDArray,
        label_levels: Sequence | NDArray | None = None,
        label_format: str | None = None,
        levels: Sequence | NDArray | None = None,
        linewidths: int | float | Sequence | NDArray | None = 1.5,
        linestyles: str | Sequence | NDArray | None = "solid",
        colors: Color | str | Sequence | NDArray | None = "black",
        zorder: int | float | None = _ZORDER_CONTOUR,
    ) -> Self:
        """Adds contour lines to the plot."""
        values = np.asarray(values)
        time = np.asarray(time)
        height = np.asarray(height)

        if len(height.shape) == 2:
            height = height[0]

        if isinstance(colors, str):
            colors = Color.from_optional(colors)
        elif is_non_str_iter_seq(colors):
            colors = [Color.from_optional(c) for c in colors]
        else:
            colors = Color.from_optional(cast(ColorLike | None, colors))

        x = time
        y = height
        z = values.T

        if len(y.shape) == 2:
            y = y[len(y) // 2]

        if isinstance(colors, list):
            shade_color = Color.from_optional(colors[0])
        else:
            shade_color = Color.from_optional(colors)

        if isinstance(shade_color, Color):
            shade_color = shade_color.get_best_bw_contrast_color()

        linewidths2: int | float | np.ndarray
        if not isinstance(linewidths, (int, float, np.number, np.ndarray)):
            linewidths2 = np.array(linewidths) * 2.5
        else:
            linewidths2 = linewidths * 2.5

        self._ax.contour(
            x,
            y,
            z,
            levels=levels,
            linewidths=linewidths2,
            colors=shade_color,
            alpha=0.5,
            linestyles="solid",
            zorder=zorder,
        )

        cn = self._ax.contour(
            x,
            y,
            z,
            levels=levels,
            linewidths=linewidths,
            colors=colors,
            linestyles=linestyles,
            zorder=zorder,
        )

        labels: Iterable[float]
        if label_levels:
            labels = [lvl for lvl in label_levels if lvl in cn.levels]
        else:
            labels = cn.levels

        self._ax.clabel(
            cn,
            labels,  # type: ignore
            inline=True,
            fmt=label_format,
            fontsize="small",
            zorder=zorder,
        )

        for t in cn.labelTexts:
            add_shade_to_text(t, alpha=0.5)
            t.set_rotation(0)

        return self

    def plot_hatch(
        self: Self,
        values: NDArray,
        time: NDArray,
        height: NDArray,
        value_range: tuple[float, float],
        hatch: str = "/////",
        linewidth: float = 1,
        linewidth_border: float = 0,
        color: ColorLike | None = "black",
        color_border: ColorLike | None = None,
        zorder: int | float | None = _ZORDER,
        legend_label: str | None = None,
    ) -> Self:
        """Adds hatched/filled areas to the plot."""
        values = np.asarray(values)
        time = np.asarray(time)
        height = np.asarray(height)

        if len(height.shape) == 2:
            height = height[0]

        color = Color.from_optional(color)
        color_border = Color.from_optional(color_border)

        cnf = self._ax.contourf(
            time,
            height,
            values.T,
            levels=[value_range[0], value_range[1]],
            colors=["none"],
            hatches=[hatch],
            zorder=zorder,
        )
        cnf.set_edgecolors(color)  # type: ignore
        cnf.set_hatch_linewidth(linewidth)

        color = Color(cnf.get_edgecolors()[0], is_normalized=True)  # type: ignore
        if color_border is None:
            color_border = color.hex
        cnf.set_color(color_border)  # type: ignore
        cnf.set_linewidth(linewidth_border)

        if isinstance(legend_label, str):
            _facecolor = "none"
            if color.is_close_to_white():
                _facecolor = color.blend(0.7, "black").hex

            hatch_patch = Patch(
                linewidth=linewidth_border,
                facecolor=_facecolor,
                edgecolor=color.hex,
                hatch=hatch,
                label=legend_label,
            )

            self._legend_handles.append(hatch_patch)
            self._legend_labels.append(legend_label)

        return self

    def ecplot_hatch(
        self: Self,
        ds: xr.Dataset,
        var: str,
        value_range: tuple[float, float],
        time_var: str = TIME_VAR,
        height_var: str = HEIGHT_VAR,
        hatch: str = "/////",
        linewidth: float = 1,
        linewidth_border: float = 0,
        color: ColorLike | None = "black",
        color_border: ColorLike | None = None,
        zorder: int | float | None = _ZORDER,
        legend_label: str | None = None,
    ) -> Self:
        """Adds hatched/filled areas to the plot."""
        height = ds[height_var].values
        time = ds[time_var].values
        values = ds[var].values

        return self.plot_hatch(
            values=values,
            time=time,
            height=height,
            value_range=value_range,
            hatch=hatch,
            linewidth=linewidth,
            linewidth_border=linewidth_border,
            color=color,
            color_border=color_border,
            zorder=zorder,
            legend_label=legend_label,
        )

    def ecplot_hatch_attenuated(
        self: Self,
        ds: xr.Dataset,
        var: str = "simple_classification",
        value_range: tuple[float, float] = (-1.5, -0.5),
        **kwargs: Any,
    ) -> Self:
        """Adds hatched area where ATLID "simple_classification" shows "attenuated" (-1)."""
        return self.ecplot_hatch(
            ds=ds,
            var=var,
            value_range=value_range,
            **kwargs,
        )

    def ecplot_contour(
        self: Self,
        ds: xr.Dataset,
        var: str,
        time_var: str = TIME_VAR,
        height_var: str = HEIGHT_VAR,
        levels: Sequence | NDArray | None = None,
        label_format: str | None = None,
        label_levels: Sequence | NDArray | None = None,
        linewidths: int | float | Sequence | NDArray | None = 1.5,
        linestyles: str | Sequence | NDArray | None = "solid",
        colors: Color | str | Sequence | NDArray | None = "black",
        zorder: float | int = _ZORDER_CONTOUR,
    ) -> Self:
        """Adds contour lines to the plot."""
        values = ds[var].values
        time = ds[time_var].values
        height = ds[height_var].values
        tp = Profile(values=values, time=time, height=height)
        self.plot_contour(
            values=tp.values,
            time=tp.time,
            height=tp.height,
            label_levels=label_levels,
            label_format=label_format,
            levels=levels,
            linewidths=linewidths,
            linestyles=linestyles,
            colors=colors,
            zorder=zorder,
        )
        return self

    def ecplot_temperature(
        self: Self,
        ds: xr.Dataset,
        var: str = TEMP_CELSIUS_VAR,
        label_format: str | None = r"$%.0f^{\circ}$C",
        label_levels: Sequence | NDArray | None = [-80, -40, 0],
        levels: Sequence | NDArray | None = None,
        linewidths: int | float | Sequence | NDArray | None = None,
        linestyles: str | Sequence | NDArray | None = None,
        colors="black",
        **kwargs: Any,
    ) -> Self:
        """Adds temperature contour lines to the plot."""
        if levels is None:
            levels, _linewidths, _linestyles = zip(*_DEFAULT_TEMPERATURE_CONTOUR_SETTINGS)
            linewidths = linewidths or _linewidths
            linestyles = linestyles or _linestyles

        return self.ecplot_contour(
            ds=ds,
            var=var,
            label_format=label_format,
            levels=levels,
            label_levels=label_levels,
            linewidths=linewidths,
            linestyles=linestyles,
            colors=colors,
            **kwargs,
        )

    def ecplot_pressure(
        self: Self,
        ds: xr.Dataset,
        var: str = PRESSURE_VAR,
        time_var: str = TIME_VAR,
        height_var: str = HEIGHT_VAR,
        label_format: str | None = r"%d hPa",
        scale: float = 0.01,
        **kwargs: Any,
    ) -> Self:
        """Adds pressure contour lines to the plot."""
        values = ds[var].values * scale
        time = ds[time_var].values
        height = ds[height_var].values
        return self.plot_contour(
            values=values,
            time=time,
            height=height,
            label_format=label_format,
            **kwargs,
        )

    def ecplot_elevation(
        self: Self,
        ds: xr.Dataset,
        var: str = ELEVATION_VAR,
        time_var: str = TIME_VAR,
        land_flag_var: str = LAND_FLAG_VAR,
        color: Color | str | None = "ec:land",
        color_water: Color | str | None = "ec:water",
        legend_label: str | None = None,
        legend_label_water: str | None = None,
        **kwargs: Any,
    ) -> Self:
        """Adds filled elevation/surface area to the plot."""
        height = ds[var].copy().values
        time = ds[time_var].copy().values

        _kwargs = dict(
            linewidth=0,
            linestyle="none",
            marker="none",
            markersize=0,
            fill=True,
            zorder=_ZORDER_ELEVATION,
        )
        _kwargs.update(kwargs)

        is_water = land_flag_var in ds.variables

        if is_water:
            land_flag = ds[land_flag_var].copy().values == 1
            height_water = height.copy()
            height_water[land_flag] = np.nan
            height[~land_flag] = np.nan

        self.plot_height(
            height=height,
            time=time,
            color=color,
            legend_label=legend_label,
            **_kwargs,  # type: ignore
        )

        if is_water:
            self.plot_height(
                height=height_water,
                time=time,
                color=color_water,
                legend_label=legend_label_water,
                **_kwargs,  # type: ignore
            )

        return self

    def ecplot_tropopause(
        self: Self,
        ds: xr.Dataset,
        var: str = TROPOPAUSE_VAR,
        time_var: str = TIME_VAR,
        color: Color | str | None = "ec:tropopause",
        linewidth: float = 2,
        linestyle: str = "solid",
        legend_label: str | None = None,
        **kwargs: Any,
    ) -> Self:
        """Adds tropopause line to the plot."""
        height = ds[var].values
        time = ds[time_var].values

        _kwargs: dict[str, Any] = dict(
            marker="none",
            markersize=0,
            fill=False,
            zorder=_ZORDER_TROPOPAUSE,
        )
        _kwargs.update(kwargs)

        self.plot_height(
            height=height,
            time=time,
            linewidth=linewidth,
            linestyle=linestyle,
            color=color,
            legend_label=legend_label,
            **_kwargs,
        )

        return self

ax property

ax: Axes

The main matplotlib axis of the figure.

colorbar property

colorbar: Colorbar | None

The matplotlib colorbar, if present.

ecplot

ecplot(
    ds: Dataset,
    var: str,
    *,
    time_var: str = TIME_VAR,
    height_var: str = HEIGHT_VAR,
    lat_var: str = TRACK_LAT_VAR,
    lon_var: str = TRACK_LON_VAR,
    temperature_var: str = TEMP_CELSIUS_VAR,
    along_track_dim: str = ALONG_TRACK_DIM,
    site: SiteLike | None = None,
    radius_km: float = 100.0,
    mark_closest: bool = False,
    show_radius: bool = True,
    show_info: bool = True,
    show_info_orbit_and_frame: bool = True,
    show_info_file_type: bool = True,
    show_info_baseline: bool = True,
    info_text_orbit_and_frame: str | None = None,
    info_text_file_type: str | None = None,
    info_text_baseline: str | None = None,
    info_text_loc: str | None = None,
    values: NDArray | None = None,
    time: NDArray | None = None,
    height: NDArray | None = None,
    latitude: NDArray | None = None,
    longitude: NDArray | None = None,
    values_temperature: NDArray | None = None,
    value_range: ValueRangeLike | Literal["default"] | None = "default",
    log_scale: bool | None = None,
    norm: Normalize | None = None,
    time_range: TimeRangeLike | None = None,
    height_range: DistanceRangeLike | None = (0, 40000.0),
    label: str | None = None,
    units: str | None = None,
    cmap: str | Colormap | None = None,
    colorbar: bool = True,
    colorbar_ticks: ArrayLike | None = None,
    colorbar_tick_labels: ArrayLike | None = None,
    colorbar_position: str | Literal["left", "right", "top", "bottom"] = "right",
    colorbar_alignment: str | Literal["left", "center", "right"] = "center",
    colorbar_width: float = DEFAULT_COLORBAR_WIDTH,
    colorbar_spacing: float = 0.2,
    colorbar_length_ratio: float | str = "100%",
    colorbar_label_outside: bool = True,
    colorbar_ticks_outside: bool = True,
    colorbar_ticks_both: bool = False,
    rolling_mean: int | None = None,
    selection_time_range: TimeRangeLike | None = None,
    selection_color: str | None = Color("ec:earthcare"),
    selection_linestyle: str | None = "dashed",
    selection_linewidth: float | int | None = 2.5,
    selection_highlight: bool = False,
    selection_highlight_inverted: bool = True,
    selection_highlight_color: str | None = Color("white"),
    selection_highlight_alpha: float = 0.5,
    selection_max_time_margin: TimedeltaLike | Sequence[TimedeltaLike] | None = None,
    ax_style_top: AlongTrackAxisStyle | str | None = None,
    ax_style_bottom: AlongTrackAxisStyle | str | None = None,
    show_temperature: bool = False,
    mode: Literal["exact", "fast"] | None = None,
    min_num_profiles: int = _MIN_NUM_PROFILES,
    mark_time: TimestampLike | Sequence[TimestampLike] | None = None,
    mark_time_color: str | Color | Sequence[str | Color | None] | None = None,
    mark_time_linestyle: str | Sequence[str] = "solid",
    mark_time_linewidth: float | Sequence[float] = 2.5,
    label_length: int = 40,
    **kwargs: Any
) -> Self

Plot a vertical curtain (i.e. cross-section) of a variable along the satellite track a EarthCARE dataset.

This method collections all required data from a EarthCARE xarray.dataset, such as time, height, latitude and longitude. It supports various forms of customization through the use of arguments listed below.

Parameters:

Name Type Description Default
ds Dataset

The EarthCARE dataset from with data will be plotted.

required
var str

Name of the variable to plot.

required
time_var str

Name of the time variable. Defaults to TIME_VAR.

TIME_VAR
height_var str

Name of the height variable. Defaults to HEIGHT_VAR.

HEIGHT_VAR
lat_var str

Name of the latitude variable. Defaults to TRACK_LAT_VAR.

TRACK_LAT_VAR
lon_var str

Name of the longitude variable. Defaults to TRACK_LON_VAR.

TRACK_LON_VAR
temperature_var str

Name of the temperature variable; ignored if show_temperature is set to False. Defaults to TEMP_CELSIUS_VAR.

TEMP_CELSIUS_VAR
along_track_dim str

Dimension name representing the along-track direction. Defaults to ALONG_TRACK_DIM.

ALONG_TRACK_DIM
values NDArray | None

Data values to be used instead of values found in the var variable of the dataset. Defaults to None.

None
time NDArray | None

Time values to be used instead of values found in the time_var variable of the dataset. Defaults to None.

None
height NDArray | None

Height values to be used instead of values found in the height_var variable of the dataset. Defaults to None.

None
latitude NDArray | None

Latitude values to be used instead of values found in the lat_var variable of the dataset. Defaults to None.

None
longitude NDArray | None

Longitude values to be used instead of values found in the lon_var variable of the dataset. Defaults to None.

None
values_temperature NDArray | None

Temperature values to be used instead of values found in the temperature_var variable of the dataset. Defaults to None.

None
site SiteLike | None

Highlights data within radius_km of a ground site (given either as a Site object or name string); ignored if not set. Defaults to None.

None
radius_km float

Radius around the ground site to highlight data from; ignored if site not set. Defaults to 100.0.

100.0
mark_closest bool

Mark the closest profile to the ground site in the plot; ignored if site not set. Defaults to False.

False
show_info bool

If True, show text on the plot containing EarthCARE frame and baseline info. Defaults to True.

True
info_text_loc str | None

Place info text at a specific location of the plot, e.g. "upper right" or "lower left". Defaults to None.

None
value_range ValueRangeLike | None

Min and max range for the variable values. Defaults to None.

'default'
log_scale bool | None

Whether to apply a logarithmic color scale. Defaults to None.

None
norm Normalize | None

Matplotlib norm to use for color scaling. Defaults to None.

None
time_range TimeRangeLike | None

Time range to restrict the data for plotting. Defaults to None.

None
height_range DistanceRangeLike | None

Height range to restrict the data for plotting. Defaults to (0, 40e3).

(0, 40000.0)
label str | None

Label to use for colorbar. Defaults to None.

None
units str | None

Units of the variable to show in the colorbar label. Defaults to None.

None
cmap str | Colormap | None

Colormap to use for plotting. Defaults to None.

None
colorbar bool

Whether to display a colorbar. Defaults to True.

True
colorbar_ticks ArrayLike | None

Custom tick values for the colorbar. Defaults to None.

None
colorbar_tick_labels ArrayLike | None

Custom labels for the colorbar ticks. Defaults to None.

None
rolling_mean int | None

Apply rolling mean along time axis with this window size. Defaults to None.

None
selection_time_range TimeRangeLike | None

Time range to highlight as a selection; ignored if site is set. Defaults to None.

None
selection_color _type_

Color for the selection range marker lines. Defaults to Color("ec:earthcare").

Color('ec:earthcare')
selection_linestyle str | None

Line style for selection range markers. Defaults to "dashed".

'dashed'
selection_linewidth float | int | None

Line width for selection range markers. Defaults to 2.5.

2.5
selection_highlight bool

Whether to highlight the selection region by shading outside or inside areas. Defaults to False.

False
selection_highlight_inverted bool

If True and selection_highlight is also set to True, areas outside the selection are shaded. Defaults to True.

True
selection_highlight_color str | None

If True and selection_highlight is also set to True, sets color used for shading selected outside or inside areas. Defaults to Color("white").

Color('white')
selection_highlight_alpha float

If True and selection_highlight is also set to True, sets transparency used for shading selected outside or inside areas.. Defaults to 0.5.

0.5
selection_max_time_margin TimedeltaLike | Sequence[TimedeltaLike]

Zooms the time axis to a given maximum time from a selected time area. Defaults to None.

None
ax_style_top AlongTrackAxisStyle | str | None

Style for the top axis (e.g., geo, lat, lon, distance, time, utc, lst, none). Defaults to None.

None
ax_style_bottom AlongTrackAxisStyle | str | None

Style for the bottom axis (e.g., geo, lat, lon, distance, time, utc, lst, none). Defaults to None.

None
show_temperature bool

Whether to overlay temperature as contours; requires either values_temperature or temperature_var. Defaults to False.

False
mode Literal['exact', 'fast'] | None

Overwrites the curtain plotting mode. Use "fast" to speed up plotting by coarsening data to at least min_num_profiles; "exact" plots full resolution. Defaults to None.

None
min_num_profiles int

Overwrites the minimum number of profiles to keep when using "fast" mode. Defaults to 5000.

_MIN_NUM_PROFILES
mark_time Sequence[TimestampLike] | None

Timestamps at which to mark vertical profiles. Defaults to None.

None

Returns:

Name Type Description
CurtainFigure Self

The figure object containing the curtain plot.

Example
import earthcarekit as eck

filepath = (
    "path/to/mydata/ECA_EXAE_ATL_NOM_1B_20250606T132535Z_20250606T150730Z_05813D.h5"
)
with eck.read_product(filepath) as ds:
    cf = eck.CurtainFigure()
    cf = cf.ecplot(ds, "mie_attenuated_backscatter", height_range=(0, 20e3))
Source code in earthcarekit/plot/figure/curtain.py
def ecplot(
    self: Self,
    ds: xr.Dataset,
    var: str,
    *,
    time_var: str = TIME_VAR,
    height_var: str = HEIGHT_VAR,
    lat_var: str = TRACK_LAT_VAR,
    lon_var: str = TRACK_LON_VAR,
    temperature_var: str = TEMP_CELSIUS_VAR,
    along_track_dim: str = ALONG_TRACK_DIM,
    site: SiteLike | None = None,
    radius_km: float = 100.0,
    mark_closest: bool = False,
    show_radius: bool = True,
    show_info: bool = True,
    show_info_orbit_and_frame: bool = True,
    show_info_file_type: bool = True,
    show_info_baseline: bool = True,
    info_text_orbit_and_frame: str | None = None,
    info_text_file_type: str | None = None,
    info_text_baseline: str | None = None,
    info_text_loc: str | None = None,
    # Common args for wrappers
    values: NDArray | None = None,
    time: NDArray | None = None,
    height: NDArray | None = None,
    latitude: NDArray | None = None,
    longitude: NDArray | None = None,
    values_temperature: NDArray | None = None,
    value_range: ValueRangeLike | Literal["default"] | None = "default",
    log_scale: bool | None = None,
    norm: Normalize | None = None,
    time_range: TimeRangeLike | None = None,
    height_range: DistanceRangeLike | None = (0, 40e3),
    label: str | None = None,
    units: str | None = None,
    cmap: str | Colormap | None = None,
    colorbar: bool = True,
    colorbar_ticks: ArrayLike | None = None,
    colorbar_tick_labels: ArrayLike | None = None,
    colorbar_position: str | Literal["left", "right", "top", "bottom"] = "right",
    colorbar_alignment: str | Literal["left", "center", "right"] = "center",
    colorbar_width: float = DEFAULT_COLORBAR_WIDTH,
    colorbar_spacing: float = 0.2,
    colorbar_length_ratio: float | str = "100%",
    colorbar_label_outside: bool = True,
    colorbar_ticks_outside: bool = True,
    colorbar_ticks_both: bool = False,
    rolling_mean: int | None = None,
    selection_time_range: TimeRangeLike | None = None,
    selection_color: str | None = Color("ec:earthcare"),
    selection_linestyle: str | None = "dashed",
    selection_linewidth: float | int | None = 2.5,
    selection_highlight: bool = False,
    selection_highlight_inverted: bool = True,
    selection_highlight_color: str | None = Color("white"),
    selection_highlight_alpha: float = 0.5,
    selection_max_time_margin: (TimedeltaLike | Sequence[TimedeltaLike] | None) = None,
    ax_style_top: AlongTrackAxisStyle | str | None = None,
    ax_style_bottom: AlongTrackAxisStyle | str | None = None,
    show_temperature: bool = False,
    mode: Literal["exact", "fast"] | None = None,
    min_num_profiles: int = _MIN_NUM_PROFILES,
    mark_time: TimestampLike | Sequence[TimestampLike] | None = None,
    mark_time_color: (str | Color | Sequence[str | Color | None] | None) = None,
    mark_time_linestyle: str | Sequence[str] = "solid",
    mark_time_linewidth: float | Sequence[float] = 2.5,
    label_length: int = 40,
    **kwargs: Any,
) -> Self:
    """Plot a vertical curtain (i.e. cross-section) of a variable along the satellite track a EarthCARE dataset.

    This method collections all required data from a EarthCARE `xarray.dataset`, such as time, height, latitude and longitude.
    It supports various forms of customization through the use of arguments listed below.

    Args:
        ds (xr.Dataset): The EarthCARE dataset from with data will be plotted.
        var (str): Name of the variable to plot.
        time_var (str, optional): Name of the time variable. Defaults to TIME_VAR.
        height_var (str, optional): Name of the height variable. Defaults to HEIGHT_VAR.
        lat_var (str, optional): Name of the latitude variable. Defaults to TRACK_LAT_VAR.
        lon_var (str, optional): Name of the longitude variable. Defaults to TRACK_LON_VAR.
        temperature_var (str, optional): Name of the temperature variable; ignored if `show_temperature` is set to False. Defaults to TEMP_CELSIUS_VAR.
        along_track_dim (str, optional): Dimension name representing the along-track direction. Defaults to ALONG_TRACK_DIM.
        values (NDArray | None, optional): Data values to be used instead of values found in the `var` variable of the dataset. Defaults to None.
        time (NDArray | None, optional): Time values to be used instead of values found in the `time_var` variable of the dataset. Defaults to None.
        height (NDArray | None, optional): Height values to be used instead of values found in the `height_var` variable of the dataset. Defaults to None.
        latitude (NDArray | None, optional): Latitude values to be used instead of values found in the `lat_var` variable of the dataset. Defaults to None.
        longitude (NDArray | None, optional): Longitude values to be used instead of values found in the `lon_var` variable of the dataset. Defaults to None.
        values_temperature (NDArray | None, optional): Temperature values to be used instead of values found in the `temperature_var` variable of the dataset. Defaults to None.
        site (SiteLike | None, optional): Highlights data within `radius_km` of a ground site (given either as a `Site` object or name string); ignored if not set. Defaults to None.
        radius_km (float, optional): Radius around the ground site to highlight data from; ignored if `site` not set. Defaults to 100.0.
        mark_closest (bool, optional): Mark the closest profile to the ground site in the plot; ignored if `site` not set. Defaults to False.
        show_info (bool, optional): If True, show text on the plot containing EarthCARE frame and baseline info. Defaults to True.
        info_text_loc (str | None, optional): Place info text at a specific location of the plot, e.g. "upper right" or "lower left". Defaults to None.
        value_range (ValueRangeLike | None, optional): Min and max range for the variable values. Defaults to None.
        log_scale (bool | None, optional): Whether to apply a logarithmic color scale. Defaults to None.
        norm (Normalize | None, optional): Matplotlib norm to use for color scaling. Defaults to None.
        time_range (TimeRangeLike | None, optional): Time range to restrict the data for plotting. Defaults to None.
        height_range (DistanceRangeLike | None, optional): Height range to restrict the data for plotting. Defaults to (0, 40e3).
        label (str | None, optional): Label to use for colorbar. Defaults to None.
        units (str | None, optional): Units of the variable to show in the colorbar label. Defaults to None.
        cmap (str | Colormap | None, optional): Colormap to use for plotting. Defaults to None.
        colorbar (bool, optional): Whether to display a colorbar. Defaults to True.
        colorbar_ticks (ArrayLike | None, optional): Custom tick values for the colorbar. Defaults to None.
        colorbar_tick_labels (ArrayLike | None, optional): Custom labels for the colorbar ticks. Defaults to None.
        rolling_mean (int | None, optional): Apply rolling mean along time axis with this window size. Defaults to None.
        selection_time_range (TimeRangeLike | None, optional): Time range to highlight as a selection; ignored if `site` is set. Defaults to None.
        selection_color (_type_, optional): Color for the selection range marker lines. Defaults to Color("ec:earthcare").
        selection_linestyle (str | None, optional): Line style for selection range markers. Defaults to "dashed".
        selection_linewidth (float | int | None, optional): Line width for selection range markers. Defaults to 2.5.
        selection_highlight (bool, optional): Whether to highlight the selection region by shading outside or inside areas. Defaults to False.
        selection_highlight_inverted (bool, optional): If True and `selection_highlight` is also set to True, areas outside the selection are shaded. Defaults to True.
        selection_highlight_color (str | None, optional): If True and `selection_highlight` is also set to True, sets color used for shading selected outside or inside areas. Defaults to Color("white").
        selection_highlight_alpha (float, optional): If True and `selection_highlight` is also set to True, sets transparency used for shading selected outside or inside areas.. Defaults to 0.5.
        selection_max_time_margin (TimedeltaLike | Sequence[TimedeltaLike], optional): Zooms the time axis to a given maximum time from a selected time area. Defaults to None.
        ax_style_top (AlongTrackAxisStyle | str | None, optional): Style for the top axis (e.g., geo, lat, lon, distance, time, utc, lst, none). Defaults to None.
        ax_style_bottom (AlongTrackAxisStyle | str | None, optional): Style for the bottom axis (e.g., geo, lat, lon, distance, time, utc, lst, none). Defaults to None.
        show_temperature (bool, optional): Whether to overlay temperature as contours; requires either `values_temperature` or `temperature_var`. Defaults to False.
        mode (Literal["exact", "fast"] | None, optional): Overwrites the curtain plotting mode. Use "fast" to speed up plotting by coarsening data to at least `min_num_profiles`; "exact" plots full resolution. Defaults to None.
        min_num_profiles (int, optional): Overwrites the minimum number of profiles to keep when using "fast" mode. Defaults to 5000.
        mark_time (Sequence[TimestampLike] | None, optional): Timestamps at which to mark vertical profiles. Defaults to None.

    Returns:
        CurtainFigure: The figure object containing the curtain plot.

    Example:
        ```python
        import earthcarekit as eck

        filepath = (
            "path/to/mydata/ECA_EXAE_ATL_NOM_1B_20250606T132535Z_20250606T150730Z_05813D.h5"
        )
        with eck.read_product(filepath) as ds:
            cf = eck.CurtainFigure()
            cf = cf.ecplot(ds, "mie_attenuated_backscatter", height_range=(0, 20e3))
        ```
    """

    # Collect all common args for wrapped plot function call
    local_args = locals()

    # Handle deprecated arguments
    def _get_depr_arg(old_name: str, new_name: str) -> Any:
        if old_name in kwargs:
            msg = f"'{old_name}' is deprecated and will be removed in future versions; use '{new_name}' instead."
            warnings.warn(msg, FutureWarning, stacklevel=2)
            out = kwargs.get(old_name, local_args[new_name])
            del kwargs[old_name]
            return out
        return local_args[new_name]

    mark_closest = _get_depr_arg("mark_closest_profile", "mark_closest")
    kwargs["mark_time"] = _get_depr_arg("mark_profiles_at", "mark_time")
    kwargs["mark_time_color"] = _get_depr_arg("mark_profiles_at_color", "mark_time_color")
    kwargs["mark_time_linestyle"] = _get_depr_arg(
        "mark_profiles_at_linestyle", "mark_time_linestyle"
    )
    kwargs["mark_time_linewidth"] = _get_depr_arg(
        "mark_profiles_at_linewidth", "mark_time_linewidth"
    )

    # Delete all args specific to this wrapper function
    del local_args["self"]
    del local_args["ds"]
    del local_args["var"]
    del local_args["time_var"]
    del local_args["height_var"]
    del local_args["lat_var"]
    del local_args["lon_var"]
    del local_args["temperature_var"]
    del local_args["along_track_dim"]
    del local_args["site"]
    del local_args["radius_km"]
    del local_args["show_info"]
    del local_args["show_info_orbit_and_frame"]
    del local_args["show_info_file_type"]
    del local_args["show_info_baseline"]
    del local_args["info_text_orbit_and_frame"]
    del local_args["info_text_file_type"]
    del local_args["info_text_baseline"]
    del local_args["show_radius"]
    del local_args["info_text_loc"]
    del local_args["mark_closest"]

    # Delete kwargs to then merge it with the residual common args
    del local_args["kwargs"]
    all_args = {**local_args, **kwargs}

    warn_about_variable_limitations(var)

    if all_args["values"] is None:
        all_args["values"] = ds[var].values
    if all_args["time"] is None:
        all_args["time"] = ds[time_var].values
    if all_args["height"] is None:
        all_args["height"] = ds[height_var].values
    if all_args["latitude"] is None:
        all_args["latitude"] = ds[lat_var].values if lat_var in ds else None
    if all_args["longitude"] is None:
        all_args["longitude"] = ds[lon_var].values if lon_var in ds else None
    if all_args["values_temperature"] is None:
        if not show_temperature:
            all_args["values_temperature"] = None
        elif ds.get(temperature_var, None) is None:
            warnings.warn(
                f'No temperature variable called "{temperature_var}" found in given dataset.'
            )
            all_args["values_temperature"] = None
        else:
            all_args["values_temperature"] = ds[temperature_var].values

    # Set default values depending on variable name
    if label is None:
        all_args["label"] = "Values" if not hasattr(ds[var], "long_name") else ds[var].long_name
    if units is None:
        all_args["units"] = "-" if not hasattr(ds[var], "units") else ds[var].units
    if isinstance(value_range, str) and value_range == "default":
        value_range = None
        all_args["value_range"] = None
        if norm is None:
            all_args["norm"] = get_default_norm(var, file_type=ds)
    if rolling_mean is None:
        all_args["rolling_mean"] = get_default_rolling_mean(var, file_type=ds)
    if cmap is None:
        all_args["cmap"] = get_default_cmap(var, file_type=ds)
    all_args["cmap"] = get_cmap(all_args["cmap"])

    if all_args["cmap"] == get_cmap("synergetic_tc"):
        self.colorbar_tick_scale = 0.8

    # Handle overpass
    all_args = self._add_overpass_marks(
        all_args=all_args,
        ds=ds,
        time_var=time_var,
        lat_var=lat_var,
        lon_var=lon_var,
        along_track_dim=along_track_dim,
        site=site,
        radius_km=radius_km,
        mark_closest=mark_closest,
        show_radius=show_radius,
    )

    self.plot(**all_args)

    self._set_info_text_loc(info_text_loc)
    if show_info:
        self.info_text = add_text_product_info(
            self._ax,
            ds,
            append_to=self.info_text,
            loc=self.info_text_loc,
            show_orbit_and_frame=show_info_orbit_and_frame,
            show_file_type=show_info_file_type,
            show_baseline=show_info_baseline,
            text_orbit_and_frame=info_text_orbit_and_frame,
            text_file_type=info_text_file_type,
            text_baseline=info_text_baseline,
        )

    return self

ecplot_contour

ecplot_contour(
    ds: Dataset,
    var: str,
    time_var: str = TIME_VAR,
    height_var: str = HEIGHT_VAR,
    levels: Sequence | NDArray | None = None,
    label_format: str | None = None,
    label_levels: Sequence | NDArray | None = None,
    linewidths: int | float | Sequence | NDArray | None = 1.5,
    linestyles: str | Sequence | NDArray | None = "solid",
    colors: Color | str | Sequence | NDArray | None = "black",
    zorder: float | int = _ZORDER_CONTOUR,
) -> Self

Adds contour lines to the plot.

Source code in earthcarekit/plot/figure/curtain.py
def ecplot_contour(
    self: Self,
    ds: xr.Dataset,
    var: str,
    time_var: str = TIME_VAR,
    height_var: str = HEIGHT_VAR,
    levels: Sequence | NDArray | None = None,
    label_format: str | None = None,
    label_levels: Sequence | NDArray | None = None,
    linewidths: int | float | Sequence | NDArray | None = 1.5,
    linestyles: str | Sequence | NDArray | None = "solid",
    colors: Color | str | Sequence | NDArray | None = "black",
    zorder: float | int = _ZORDER_CONTOUR,
) -> Self:
    """Adds contour lines to the plot."""
    values = ds[var].values
    time = ds[time_var].values
    height = ds[height_var].values
    tp = Profile(values=values, time=time, height=height)
    self.plot_contour(
        values=tp.values,
        time=tp.time,
        height=tp.height,
        label_levels=label_levels,
        label_format=label_format,
        levels=levels,
        linewidths=linewidths,
        linestyles=linestyles,
        colors=colors,
        zorder=zorder,
    )
    return self

ecplot_elevation

ecplot_elevation(
    ds: Dataset,
    var: str = ELEVATION_VAR,
    time_var: str = TIME_VAR,
    land_flag_var: str = LAND_FLAG_VAR,
    color: Color | str | None = "ec:land",
    color_water: Color | str | None = "ec:water",
    legend_label: str | None = None,
    legend_label_water: str | None = None,
    **kwargs: Any
) -> Self

Adds filled elevation/surface area to the plot.

Source code in earthcarekit/plot/figure/curtain.py
def ecplot_elevation(
    self: Self,
    ds: xr.Dataset,
    var: str = ELEVATION_VAR,
    time_var: str = TIME_VAR,
    land_flag_var: str = LAND_FLAG_VAR,
    color: Color | str | None = "ec:land",
    color_water: Color | str | None = "ec:water",
    legend_label: str | None = None,
    legend_label_water: str | None = None,
    **kwargs: Any,
) -> Self:
    """Adds filled elevation/surface area to the plot."""
    height = ds[var].copy().values
    time = ds[time_var].copy().values

    _kwargs = dict(
        linewidth=0,
        linestyle="none",
        marker="none",
        markersize=0,
        fill=True,
        zorder=_ZORDER_ELEVATION,
    )
    _kwargs.update(kwargs)

    is_water = land_flag_var in ds.variables

    if is_water:
        land_flag = ds[land_flag_var].copy().values == 1
        height_water = height.copy()
        height_water[land_flag] = np.nan
        height[~land_flag] = np.nan

    self.plot_height(
        height=height,
        time=time,
        color=color,
        legend_label=legend_label,
        **_kwargs,  # type: ignore
    )

    if is_water:
        self.plot_height(
            height=height_water,
            time=time,
            color=color_water,
            legend_label=legend_label_water,
            **_kwargs,  # type: ignore
        )

    return self

ecplot_hatch

ecplot_hatch(
    ds: Dataset,
    var: str,
    value_range: tuple[float, float],
    time_var: str = TIME_VAR,
    height_var: str = HEIGHT_VAR,
    hatch: str = "/////",
    linewidth: float = 1,
    linewidth_border: float = 0,
    color: ColorLike | None = "black",
    color_border: ColorLike | None = None,
    zorder: int | float | None = _ZORDER,
    legend_label: str | None = None,
) -> Self

Adds hatched/filled areas to the plot.

Source code in earthcarekit/plot/figure/curtain.py
def ecplot_hatch(
    self: Self,
    ds: xr.Dataset,
    var: str,
    value_range: tuple[float, float],
    time_var: str = TIME_VAR,
    height_var: str = HEIGHT_VAR,
    hatch: str = "/////",
    linewidth: float = 1,
    linewidth_border: float = 0,
    color: ColorLike | None = "black",
    color_border: ColorLike | None = None,
    zorder: int | float | None = _ZORDER,
    legend_label: str | None = None,
) -> Self:
    """Adds hatched/filled areas to the plot."""
    height = ds[height_var].values
    time = ds[time_var].values
    values = ds[var].values

    return self.plot_hatch(
        values=values,
        time=time,
        height=height,
        value_range=value_range,
        hatch=hatch,
        linewidth=linewidth,
        linewidth_border=linewidth_border,
        color=color,
        color_border=color_border,
        zorder=zorder,
        legend_label=legend_label,
    )

ecplot_hatch_attenuated

ecplot_hatch_attenuated(
    ds: Dataset,
    var: str = "simple_classification",
    value_range: tuple[float, float] = (-1.5, -0.5),
    **kwargs: Any
) -> Self

Adds hatched area where ATLID "simple_classification" shows "attenuated" (-1).

Source code in earthcarekit/plot/figure/curtain.py
def ecplot_hatch_attenuated(
    self: Self,
    ds: xr.Dataset,
    var: str = "simple_classification",
    value_range: tuple[float, float] = (-1.5, -0.5),
    **kwargs: Any,
) -> Self:
    """Adds hatched area where ATLID "simple_classification" shows "attenuated" (-1)."""
    return self.ecplot_hatch(
        ds=ds,
        var=var,
        value_range=value_range,
        **kwargs,
    )

ecplot_height

ecplot_height(
    ds: Dataset,
    var: str,
    time_var: str = TIME_VAR,
    linewidth: int | float | None = 1.5,
    linestyle: str | None = "none",
    color: Color | str | None = "black",
    zorder: int | float | None = _ZORDER,
    marker: str | None = "s",
    markersize: int | float | None = 1,
    show_info: bool = True,
    info_text_loc: str | None = None,
    legend_label: str | None = None,
) -> Self

Adds height line to the plot.

Source code in earthcarekit/plot/figure/curtain.py
def ecplot_height(
    self: Self,
    ds: xr.Dataset,
    var: str,
    time_var: str = TIME_VAR,
    linewidth: int | float | None = 1.5,
    linestyle: str | None = "none",
    color: Color | str | None = "black",
    zorder: int | float | None = _ZORDER,
    marker: str | None = "s",
    markersize: int | float | None = 1,
    show_info: bool = True,
    info_text_loc: str | None = None,
    legend_label: str | None = None,
) -> Self:
    """Adds height line to the plot."""
    height = ds[var].values
    time = ds[time_var].values
    self.plot_height(
        height=height,
        time=time,
        linewidth=linewidth,
        linestyle=linestyle,
        color=color,
        zorder=zorder,
        marker=marker,
        markersize=markersize,
        legend_label=legend_label,
    )

    self._set_info_text_loc(info_text_loc)
    if show_info:
        self.info_text = add_text_product_info(
            self._ax, ds, append_to=self.info_text, loc=self.info_text_loc
        )

    return self

ecplot_pressure

ecplot_pressure(
    ds: Dataset,
    var: str = PRESSURE_VAR,
    time_var: str = TIME_VAR,
    height_var: str = HEIGHT_VAR,
    label_format: str | None = "%d hPa",
    scale: float = 0.01,
    **kwargs: Any
) -> Self

Adds pressure contour lines to the plot.

Source code in earthcarekit/plot/figure/curtain.py
def ecplot_pressure(
    self: Self,
    ds: xr.Dataset,
    var: str = PRESSURE_VAR,
    time_var: str = TIME_VAR,
    height_var: str = HEIGHT_VAR,
    label_format: str | None = r"%d hPa",
    scale: float = 0.01,
    **kwargs: Any,
) -> Self:
    """Adds pressure contour lines to the plot."""
    values = ds[var].values * scale
    time = ds[time_var].values
    height = ds[height_var].values
    return self.plot_contour(
        values=values,
        time=time,
        height=height,
        label_format=label_format,
        **kwargs,
    )

ecplot_temperature

ecplot_temperature(
    ds: Dataset,
    var: str = TEMP_CELSIUS_VAR,
    label_format: str | None = "$%.0f^{\\circ}$C",
    label_levels: Sequence | NDArray | None = [-80, -40, 0],
    levels: Sequence | NDArray | None = None,
    linewidths: int | float | Sequence | NDArray | None = None,
    linestyles: str | Sequence | NDArray | None = None,
    colors="black",
    **kwargs: Any
) -> Self

Adds temperature contour lines to the plot.

Source code in earthcarekit/plot/figure/curtain.py
def ecplot_temperature(
    self: Self,
    ds: xr.Dataset,
    var: str = TEMP_CELSIUS_VAR,
    label_format: str | None = r"$%.0f^{\circ}$C",
    label_levels: Sequence | NDArray | None = [-80, -40, 0],
    levels: Sequence | NDArray | None = None,
    linewidths: int | float | Sequence | NDArray | None = None,
    linestyles: str | Sequence | NDArray | None = None,
    colors="black",
    **kwargs: Any,
) -> Self:
    """Adds temperature contour lines to the plot."""
    if levels is None:
        levels, _linewidths, _linestyles = zip(*_DEFAULT_TEMPERATURE_CONTOUR_SETTINGS)
        linewidths = linewidths or _linewidths
        linestyles = linestyles or _linestyles

    return self.ecplot_contour(
        ds=ds,
        var=var,
        label_format=label_format,
        levels=levels,
        label_levels=label_levels,
        linewidths=linewidths,
        linestyles=linestyles,
        colors=colors,
        **kwargs,
    )

ecplot_tropopause

ecplot_tropopause(
    ds: Dataset,
    var: str = TROPOPAUSE_VAR,
    time_var: str = TIME_VAR,
    color: Color | str | None = "ec:tropopause",
    linewidth: float = 2,
    linestyle: str = "solid",
    legend_label: str | None = None,
    **kwargs: Any
) -> Self

Adds tropopause line to the plot.

Source code in earthcarekit/plot/figure/curtain.py
def ecplot_tropopause(
    self: Self,
    ds: xr.Dataset,
    var: str = TROPOPAUSE_VAR,
    time_var: str = TIME_VAR,
    color: Color | str | None = "ec:tropopause",
    linewidth: float = 2,
    linestyle: str = "solid",
    legend_label: str | None = None,
    **kwargs: Any,
) -> Self:
    """Adds tropopause line to the plot."""
    height = ds[var].values
    time = ds[time_var].values

    _kwargs: dict[str, Any] = dict(
        marker="none",
        markersize=0,
        fill=False,
        zorder=_ZORDER_TROPOPAUSE,
    )
    _kwargs.update(kwargs)

    self.plot_height(
        height=height,
        time=time,
        linewidth=linewidth,
        linestyle=linestyle,
        color=color,
        legend_label=legend_label,
        **_kwargs,
    )

    return self

fig property

fig: Figure

The underlying matplotlib figure.

invert_xaxis

invert_xaxis() -> Self

Invert the x-axis.

Source code in earthcarekit/plot/figure/_figure/base.py
def invert_xaxis(self) -> Self:
    """Invert the x-axis."""
    self._ax.invert_xaxis()
    if self._ax_top:
        self._ax_top.invert_xaxis()
    return self

invert_yaxis

invert_yaxis() -> Self

Invert the y-axis.

Source code in earthcarekit/plot/figure/_figure/base.py
def invert_yaxis(self) -> Self:
    """Invert the y-axis."""
    self._ax.invert_yaxis()
    if self._ax_right:
        self._ax_right.invert_yaxis()
    return self

legend property

legend: Legend | None

The matplotlib legend, if present.

plot_contour

plot_contour(
    values: NDArray,
    time: NDArray,
    height: NDArray,
    label_levels: Sequence | NDArray | None = None,
    label_format: str | None = None,
    levels: Sequence | NDArray | None = None,
    linewidths: int | float | Sequence | NDArray | None = 1.5,
    linestyles: str | Sequence | NDArray | None = "solid",
    colors: Color | str | Sequence | NDArray | None = "black",
    zorder: int | float | None = _ZORDER_CONTOUR,
) -> Self

Adds contour lines to the plot.

Source code in earthcarekit/plot/figure/curtain.py
def plot_contour(
    self: Self,
    values: NDArray,
    time: NDArray,
    height: NDArray,
    label_levels: Sequence | NDArray | None = None,
    label_format: str | None = None,
    levels: Sequence | NDArray | None = None,
    linewidths: int | float | Sequence | NDArray | None = 1.5,
    linestyles: str | Sequence | NDArray | None = "solid",
    colors: Color | str | Sequence | NDArray | None = "black",
    zorder: int | float | None = _ZORDER_CONTOUR,
) -> Self:
    """Adds contour lines to the plot."""
    values = np.asarray(values)
    time = np.asarray(time)
    height = np.asarray(height)

    if len(height.shape) == 2:
        height = height[0]

    if isinstance(colors, str):
        colors = Color.from_optional(colors)
    elif is_non_str_iter_seq(colors):
        colors = [Color.from_optional(c) for c in colors]
    else:
        colors = Color.from_optional(cast(ColorLike | None, colors))

    x = time
    y = height
    z = values.T

    if len(y.shape) == 2:
        y = y[len(y) // 2]

    if isinstance(colors, list):
        shade_color = Color.from_optional(colors[0])
    else:
        shade_color = Color.from_optional(colors)

    if isinstance(shade_color, Color):
        shade_color = shade_color.get_best_bw_contrast_color()

    linewidths2: int | float | np.ndarray
    if not isinstance(linewidths, (int, float, np.number, np.ndarray)):
        linewidths2 = np.array(linewidths) * 2.5
    else:
        linewidths2 = linewidths * 2.5

    self._ax.contour(
        x,
        y,
        z,
        levels=levels,
        linewidths=linewidths2,
        colors=shade_color,
        alpha=0.5,
        linestyles="solid",
        zorder=zorder,
    )

    cn = self._ax.contour(
        x,
        y,
        z,
        levels=levels,
        linewidths=linewidths,
        colors=colors,
        linestyles=linestyles,
        zorder=zorder,
    )

    labels: Iterable[float]
    if label_levels:
        labels = [lvl for lvl in label_levels if lvl in cn.levels]
    else:
        labels = cn.levels

    self._ax.clabel(
        cn,
        labels,  # type: ignore
        inline=True,
        fmt=label_format,
        fontsize="small",
        zorder=zorder,
    )

    for t in cn.labelTexts:
        add_shade_to_text(t, alpha=0.5)
        t.set_rotation(0)

    return self

plot_hatch

plot_hatch(
    values: NDArray,
    time: NDArray,
    height: NDArray,
    value_range: tuple[float, float],
    hatch: str = "/////",
    linewidth: float = 1,
    linewidth_border: float = 0,
    color: ColorLike | None = "black",
    color_border: ColorLike | None = None,
    zorder: int | float | None = _ZORDER,
    legend_label: str | None = None,
) -> Self

Adds hatched/filled areas to the plot.

Source code in earthcarekit/plot/figure/curtain.py
def plot_hatch(
    self: Self,
    values: NDArray,
    time: NDArray,
    height: NDArray,
    value_range: tuple[float, float],
    hatch: str = "/////",
    linewidth: float = 1,
    linewidth_border: float = 0,
    color: ColorLike | None = "black",
    color_border: ColorLike | None = None,
    zorder: int | float | None = _ZORDER,
    legend_label: str | None = None,
) -> Self:
    """Adds hatched/filled areas to the plot."""
    values = np.asarray(values)
    time = np.asarray(time)
    height = np.asarray(height)

    if len(height.shape) == 2:
        height = height[0]

    color = Color.from_optional(color)
    color_border = Color.from_optional(color_border)

    cnf = self._ax.contourf(
        time,
        height,
        values.T,
        levels=[value_range[0], value_range[1]],
        colors=["none"],
        hatches=[hatch],
        zorder=zorder,
    )
    cnf.set_edgecolors(color)  # type: ignore
    cnf.set_hatch_linewidth(linewidth)

    color = Color(cnf.get_edgecolors()[0], is_normalized=True)  # type: ignore
    if color_border is None:
        color_border = color.hex
    cnf.set_color(color_border)  # type: ignore
    cnf.set_linewidth(linewidth_border)

    if isinstance(legend_label, str):
        _facecolor = "none"
        if color.is_close_to_white():
            _facecolor = color.blend(0.7, "black").hex

        hatch_patch = Patch(
            linewidth=linewidth_border,
            facecolor=_facecolor,
            edgecolor=color.hex,
            hatch=hatch,
            label=legend_label,
        )

        self._legend_handles.append(hatch_patch)
        self._legend_labels.append(legend_label)

    return self

plot_height

plot_height(
    height: NDArray,
    time: NDArray,
    linewidth: int | float | None = 1.5,
    linestyle: str | None = "solid",
    color: Color | str | None = None,
    alpha: float | None = 1.0,
    zorder: int | float | None = _ZORDER,
    marker: str | None = None,
    markersize: int | float | None = None,
    fill: bool = False,
    legend_label: str | None = None,
    **kwargs: Any
) -> Self

Adds height line to the plot.

Source code in earthcarekit/plot/figure/curtain.py
def plot_height(
    self: Self,
    height: NDArray,
    time: NDArray,
    linewidth: int | float | None = 1.5,
    linestyle: str | None = "solid",
    color: Color | str | None = None,
    alpha: float | None = 1.0,
    zorder: int | float | None = _ZORDER,
    marker: str | None = None,
    markersize: int | float | None = None,
    fill: bool = False,
    legend_label: str | None = None,
    **kwargs: Any,
) -> Self:
    """Adds height line to the plot."""
    color = Color.from_optional(color)

    height = np.asarray(height)
    time = np.asarray(time)

    hnew, tnew = _convert_height_line_to_time_bin_step_function(height, time)

    fb: list = []
    if fill:
        _fb1 = self._ax.fill_between(
            tnew,
            hnew,
            y2=-5e3,
            color=color,
            alpha=alpha,
            zorder=zorder,
        )

        # Proxy for the legend
        _fb2 = Patch(facecolor=color, alpha=alpha, linewidth=0.0)
        fb = [_fb1, _fb2]

    hl = self._ax.plot(
        tnew,
        hnew,
        linestyle=linestyle,
        linewidth=linewidth,
        marker=marker,
        markersize=markersize,
        color=color,
        alpha=alpha,
        zorder=zorder,
        **kwargs,
    )

    if isinstance(legend_label, str):
        self._legend_handles.append(tuple(hl + fb))
        self._legend_labels.append(legend_label)

    return self

remove_colorbar

remove_colorbar() -> None

Remove the colorbar from the figure, if present.

Source code in earthcarekit/plot/figure/_figure/base.py
def remove_colorbar(self) -> None:
    """Remove the colorbar from the figure, if present."""
    if self._colorbar:
        self._colorbar.remove()
        self._colorbar = None

remove_legend

remove_legend() -> None

Remove the legend from the figure, if present.

Source code in earthcarekit/plot/figure/_figure/base.py
def remove_legend(self) -> None:
    """Remove the legend from the figure, if present."""
    if self._legend:
        self._legend.remove()
        self._legend = None

save

save(
    filename: str = "",
    filepath: str | None = None,
    ds: Dataset | None = None,
    ds_filepath: str | None = None,
    dpi: float | Literal["figure"] = "figure",
    orbit_and_frame: str | None = None,
    utc_timestamp: TimestampLike | None = None,
    use_utc_creation_timestamp: bool = False,
    site_name: str | None = None,
    hmax: int | float | None = None,
    radius: int | float | None = None,
    extra: str | None = None,
    transparent_outside: bool = False,
    verbose: bool = True,
    print_prefix: str = "",
    create_dirs: bool = False,
    transparent_background: bool = False,
    resolution: str | None = None,
    **kwargs
) -> None

Save a figure as an image or vector graphic to a file and optionally format the file name in a structured way using EarthCARE metadata.

Parameters:

Name Type Description Default
filename str

The base name of the file. Can be extended based on other metadata provided. Defaults to empty string.

''
filepath str | None

The path where the image is saved. Can be extended based on other metadata provided. Defaults to None.

None
ds Dataset | None

A EarthCARE dataset from which metadata will be taken. Defaults to None.

None
ds_filepath str | None

A path to a EarthCARE product from which metadata will be taken. Defaults to None.

None
dpi float | figure

The resolution in dots per inch. If 'figure', use the figure's dpi value. Defaults to None.

'figure'
orbit_and_frame str | None

Metadata used in the formatting of the file name. Defaults to None.

None
utc_timestamp TimestampLike | None

Metadata used in the formatting of the file name. Defaults to None.

None
use_utc_creation_timestamp bool

Whether the time of image creation should be included in the file name. Defaults to False.

False
site_name str | None

Metadata used in the formatting of the file name. Defaults to None.

None
hmax int | float | None

Metadata used in the formatting of the file name. Defaults to None.

None
radius int | float | None

Metadata used in the formatting of the file name. Defaults to None.

None
resolution str | None

Metadata used in the formatting of the file name. Defaults to None.

None
extra str | None

A custom string to be included in the file name. Defaults to None.

None
transparent_outside bool

Whether the area outside figures should be transparent. Defaults to False.

False
verbose bool

Whether the progress of image creation should be printed to the console. Defaults to True.

True
print_prefix str

A prefix string to all console messages. Defaults to "".

''
create_dirs bool

Whether images should be saved in a folder structure based on provided metadata. Defaults to False.

False
transparent_background bool

Whether the background inside and outside of figures should be transparent. Defaults to False.

False
**kwargs dict[str, Any]

Keyword arguments passed to wrapped function call of matplotlib.pyplot.savefig.

{}
Source code in earthcarekit/plot/figure/_figure/base.py
def save(
    self: Self,
    filename: str = "",
    filepath: str | None = None,
    ds: xr.Dataset | None = None,
    ds_filepath: str | None = None,
    dpi: float | Literal["figure"] = "figure",
    orbit_and_frame: str | None = None,
    utc_timestamp: TimestampLike | None = None,
    use_utc_creation_timestamp: bool = False,
    site_name: str | None = None,
    hmax: int | float | None = None,
    radius: int | float | None = None,
    extra: str | None = None,
    transparent_outside: bool = False,
    verbose: bool = True,
    print_prefix: str = "",
    create_dirs: bool = False,
    transparent_background: bool = False,
    resolution: str | None = None,
    **kwargs,
) -> None:
    """Save a figure as an image or vector graphic to a file and optionally
    format the file name in a structured way using EarthCARE metadata.

    Args:
        filename (str, optional):
            The base name of the file. Can be extended based on other metadata provided.
            Defaults to empty string.
        filepath (str | None, optional):
            The path where the image is saved. Can be extended based on other metadata
            provided. Defaults to None.
        ds (xr.Dataset | None, optional):
            A EarthCARE dataset from which metadata will be taken. Defaults to None.
        ds_filepath (str | None, optional):
            A path to a EarthCARE product from which metadata will be taken. Defaults to None.
        dpi (float | 'figure', optional):
            The resolution in dots per inch. If 'figure', use the figure's dpi value.
            Defaults to None.
        orbit_and_frame (str | None, optional):
            Metadata used in the formatting of the file name. Defaults to None.
        utc_timestamp (TimestampLike | None, optional):
            Metadata used in the formatting of the file name. Defaults to None.
        use_utc_creation_timestamp (bool, optional):
            Whether the time of image creation should be included in the file name.
            Defaults to False.
        site_name (str | None, optional):
            Metadata used in the formatting of the file name. Defaults to None.
        hmax (int | float | None, optional):
            Metadata used in the formatting of the file name. Defaults to None.
        radius (int | float | None, optional):
            Metadata used in the formatting of the file name. Defaults to None.
        resolution (str | None, optional):
            Metadata used in the formatting of the file name. Defaults to None.
        extra (str | None, optional):
            A custom string to be included in the file name. Defaults to None.
        transparent_outside (bool, optional):
            Whether the area outside figures should be transparent. Defaults to False.
        verbose (bool, optional):
            Whether the progress of image creation should be printed to the console.
            Defaults to True.
        print_prefix (str, optional):
            A prefix string to all console messages. Defaults to "".
        create_dirs (bool, optional):
            Whether images should be saved in a folder structure based on provided metadata.
            Defaults to False.
        transparent_background (bool, optional):
            Whether the background inside and outside of figures should be transparent.
            Defaults to False.
        **kwargs (dict[str, Any]):
            Keyword arguments passed to wrapped function call of `matplotlib.pyplot.savefig`.
    """
    save_plot(
        fig=self.fig,
        filename=filename,
        filepath=filepath,
        ds=ds,
        ds_filepath=ds_filepath,
        dpi=dpi,
        orbit_and_frame=orbit_and_frame,
        utc_timestamp=utc_timestamp,
        use_utc_creation_timestamp=use_utc_creation_timestamp,
        site_name=site_name,
        hmax=hmax,
        radius=radius,
        extra=extra,
        transparent_outside=transparent_outside,
        verbose=verbose,
        print_prefix=print_prefix,
        create_dirs=create_dirs,
        transparent_background=transparent_background,
        resolution=resolution,
        **kwargs,
    )

set_colorbar_tick_scale

set_colorbar_tick_scale(
    multiplier: float | None = None, fontsize: float | str | None = None
) -> Self

Configure the scale of the colorbar tick lables, if present.

Source code in earthcarekit/plot/figure/_figure/base.py
def set_colorbar_tick_scale(
    self: Self,
    multiplier: float | None = None,
    fontsize: float | str | None = None,
) -> Self:
    """Configure the scale of the colorbar tick lables, if present."""
    if not isinstance(self._colorbar, Colorbar) or (multiplier is None and fontsize is None):
        return self

    if fontsize is None:
        ticklabels = self._colorbar.ax.yaxis.get_ticklabels()
        if len(ticklabels) == 0:
            ticklabels = self._colorbar.ax.xaxis.get_ticklabels()
        if len(ticklabels) == 0:
            return self
        fontsize = ticklabels[0].get_fontsize()

    if isinstance(fontsize, str):
        fontsize = font_manager.FontProperties(size=fontsize).get_size_in_points()

    if multiplier is not None:
        fontsize *= multiplier

    self._colorbar.ax.tick_params(labelsize=fontsize)

    return self

set_grid

set_grid(
    visible: bool | None = None,
    which: Literal["major", "minor", "both"] | None = None,
    axis: Literal["both", "x", "y"] | None = None,
    color: ColorLike | None = None,
    alpha: float = 1.0,
    linestyle: LineStyleType | None = None,
    linewidth: float | None = None,
    **kwargs
) -> Self

Configure the grid lines of the main matplotlib axis.

Source code in earthcarekit/plot/figure/_figure/base.py
def set_grid(
    self: Self,
    visible: bool | None = None,
    which: Literal["major", "minor", "both"] | None = None,
    axis: Literal["both", "x", "y"] | None = None,
    color: ColorLike | None = None,
    alpha: float = 1.0,
    linestyle: LineStyleType | None = None,
    linewidth: float | None = None,
    **kwargs,
) -> Self:
    """Configure the grid lines of the main matplotlib axis."""
    update_if_not_none(
        d=self._grid_kwargs,
        updates=dict(
            visible=visible,
            which=which,
            axis=axis,
            color=Color.from_optional(color),
            alpha=alpha,
            linestyle=linestyle,
            linewidth=linewidth,
            **kwargs,
        ),
    )

    self._ax.grid(**self._grid_kwargs)

    return self

set_legend

set_legend(
    ax: Axes | None = None,
    loc: str | None = None,
    markerscale: float | None = None,
    frameon: bool | None = None,
    facecolor: ColorLike | None = None,
    edgecolor: ColorLike | None = None,
    framealpha: float | None = None,
    fancybox: bool | None = None,
    handlelength: float | None = None,
    handletextpad: float | None = None,
    borderaxespad: float | None = None,
    ncols: int | None = None,
    edgewidth: float | None = None,
    textcolor: ColorLike | None = None,
    textweight: int | str | None = None,
    textshadealpha: float | None = None,
    textshadewidth: float | None = None,
    textshadecolor: ColorLike | None = None,
    **kwargs
) -> Self

Configure the legend.

If no axis is given and a right-side axis is present (ax_right), the legend is attached to it so that it renders above all plot elements; otherwise, the main axis is used (ax).

Source code in earthcarekit/plot/figure/_figure/base.py
def set_legend(
    self: Self,
    ax: Axes | None = None,
    loc: str | None = None,
    markerscale: float | None = None,
    frameon: bool | None = None,
    facecolor: ColorLike | None = None,
    edgecolor: ColorLike | None = None,
    framealpha: float | None = None,
    fancybox: bool | None = None,
    handlelength: float | None = None,
    handletextpad: float | None = None,
    borderaxespad: float | None = None,
    ncols: int | None = None,
    edgewidth: float | None = None,
    textcolor: ColorLike | None = None,
    textweight: int | str | None = None,
    textshadealpha: float | None = None,
    textshadewidth: float | None = None,
    textshadecolor: ColorLike | None = None,
    **kwargs,
) -> Self:
    """Configure the legend.

    If no axis is given and a right-side axis is present (`ax_right`), the legend is attached
    to it so that it renders above all plot elements; otherwise, the main axis is used (`ax`).
    """
    self.remove_legend()

    update_if_not_none(
        d=self._legend_kwargs,
        updates=dict(
            loc=loc,
            markerscale=markerscale,
            frameon=frameon,
            facecolor=Color.from_optional(facecolor),
            edgecolor=Color.from_optional(edgecolor),
            framealpha=framealpha,
            fancybox=fancybox,
            handlelength=handlelength,
            handletextpad=handletextpad,
            borderaxespad=borderaxespad,
            ncols=ncols,
            **kwargs,
        ),
    )
    update_if_not_none(
        d=self._legend_style_kwargs,
        updates=dict(
            textcolor=Color.from_optional(textcolor),
            textweight=textweight,
            textshadealpha=textshadealpha,
            textshadewidth=textshadewidth,
            textshadecolor=Color.from_optional(textshadecolor),
            edgewidth=edgewidth,
        ),
    )

    _textcolor = self._legend_style_kwargs.get("textcolor", "black")
    _textweight = self._legend_style_kwargs.get("textweight", "normal")
    _textshadealpha = self._legend_style_kwargs.get("textshadealpha", 0.0)
    _textshadewidth = self._legend_style_kwargs.get("textshadewidth", 3.0)
    _textshadecolor = self._legend_style_kwargs.get("textshadecolor", "white")
    _edgewidth = self._legend_style_kwargs.get("edgewidth", 1.5)

    if len(self._legend_handles) > 0:
        _ax = ax or self._ax_right or self._ax
        self._legend = _ax.legend(
            self._legend_handles,
            self._legend_labels,
            **self._legend_kwargs,
            handler_map={tuple: HandlerTuple(ndivide=1)},
        )
        self._legend.get_frame().set_linewidth(_edgewidth)
        for text in self._legend.get_texts():
            text.set_color(_textcolor)
            text.set_fontweight(_textweight)

            if _textshadealpha > 0:
                text = add_shade_to_text(
                    text,
                    alpha=_textshadealpha,
                    linewidth=_textshadewidth,
                    color=_textshadecolor,
                )
    return self

show

show() -> None

Display figure in interactive frontends (e.g., IPython/jupyter notebooks).

Source code in earthcarekit/plot/figure/_figure/base.py
def show(self) -> None:
    """Display figure in interactive frontends (e.g., `IPython`/`jupyter` notebooks)."""
    import IPython
    from IPython.display import display

    if IPython.get_ipython() is not None:
        display(self.fig)
    else:
        plt.show()

show_legend

show_legend(*args, **kwargs) -> Self

Configure the legend.

Deprecated

Use set_legend() instead.

Source code in earthcarekit/plot/figure/_figure/base.py
def show_legend(self: Self, *args, **kwargs) -> Self:
    """Configure the legend.

    Deprecated:
        Use `set_legend()` instead.
    """
    import warnings

    warnings.warn(
        "'show_legend()' is deprecated; use 'set_legend()' instead.",
        DeprecationWarning,
        stacklevel=2,
    )
    return self.set_legend(*args, **kwargs)

to_texture

to_texture() -> Self

Convert the figure to a texture (i.e., remove all axis ticks, labels, annotations, and text).

Source code in earthcarekit/plot/figure/_figure/base.py
def to_texture(self) -> Self:
    """Convert the figure to a texture
    (i.e., remove all axis ticks, labels, annotations, and text).
    """
    for ax in (self._ax, self._ax_top, self._ax_right):
        remove_arists(ax)
        remove_axis_grid_ticks_labels(ax)

    remove_white_frame_around_figure(self.fig)
    remove_colorbar(self._colorbar)
    remove_legend(self._legend)

    return self

LineFigure

Bases: TimeseriesFigure

TODO: documentation

Source code in earthcarekit/plot/figure/line.py
 40
 41
 42
 43
 44
 45
 46
 47
 48
 49
 50
 51
 52
 53
 54
 55
 56
 57
 58
 59
 60
 61
 62
 63
 64
 65
 66
 67
 68
 69
 70
 71
 72
 73
 74
 75
 76
 77
 78
 79
 80
 81
 82
 83
 84
 85
 86
 87
 88
 89
 90
 91
 92
 93
 94
 95
 96
 97
 98
 99
100
101
102
103
104
105
106
107
108
109
110
111
112
113
114
115
116
117
118
119
120
121
122
123
124
125
126
127
128
129
130
131
132
133
134
135
136
137
138
139
140
141
142
143
144
145
146
147
148
149
150
151
152
153
154
155
156
157
158
159
160
161
162
163
164
165
166
167
168
169
170
171
172
173
174
175
176
177
178
179
180
181
182
183
184
185
186
187
188
189
190
191
192
193
194
195
196
197
198
199
200
201
202
203
204
205
206
207
208
209
210
211
212
213
214
215
216
217
218
219
220
221
222
223
224
225
226
227
228
229
230
231
232
233
234
235
236
237
238
239
240
241
242
243
244
245
246
247
248
249
250
251
252
253
254
255
256
257
258
259
260
261
262
263
264
265
266
267
268
269
270
271
272
273
274
275
276
277
278
279
280
281
282
283
284
285
286
287
288
289
290
291
292
293
294
295
296
297
298
299
300
301
302
303
304
305
306
307
308
309
310
311
312
313
314
315
316
317
318
319
320
321
322
323
324
325
326
327
328
329
330
331
332
333
334
335
336
337
338
339
340
341
342
343
344
345
346
347
348
349
350
351
352
353
354
355
356
357
358
359
360
361
362
363
364
365
366
367
368
369
370
371
372
373
374
375
376
377
378
379
380
381
382
383
384
385
386
387
388
389
390
391
392
393
394
395
396
397
398
399
400
401
402
403
404
405
406
407
408
409
410
411
412
413
414
415
416
417
418
419
420
421
422
423
424
425
426
427
428
429
430
431
432
433
434
435
436
437
438
439
440
441
442
443
444
445
446
447
448
449
450
451
452
453
454
455
456
457
458
459
460
461
462
463
464
465
466
467
468
469
470
471
472
473
class LineFigure(TimeseriesFigure):
    """TODO: documentation"""

    def __init__(
        self: Self,
        ax: Axes | None = None,
        fig: Figure | None = None,
        figsize: tuple[float, float] = (FIGURE_WIDTH_LINE, FIGURE_HEIGHT_LINE),
        dpi: float | None = None,
        title: str | None = None,
        fig_height_scale: float = 1.0,
        fig_width_scale: float = 1.0,
        axes_rect: tuple[float, float, float, float] = (0.0, 0.0, 1.0, 1.0),
        show_grid: bool | None = True,
        grid_kwargs: dict[str, Any] = {},
        title_kwargs: dict[str, Any] = {},
        # base
        num_ticks: int = 10,
        ax_style_top: AlongTrackAxisStyle | str = "geo",
        ax_style_bottom: AlongTrackAxisStyle | str = "time",
        show_y_right: bool = False,
        show_y_left: bool = True,
        # timeseries
        show_value_left: bool = True,
        show_value_right: bool = False,
        mode: str | Literal["line", "scatter", "area"] = "line",
    ) -> None:
        super().__init__(
            ax=ax,
            fig=fig,
            figsize=figsize,
            dpi=dpi,
            title=title,
            fig_height_scale=fig_height_scale,
            fig_width_scale=fig_width_scale,
            axes_rect=axes_rect,
            show_grid=show_grid,
            grid_kwargs=grid_kwargs,
            title_kwargs=title_kwargs,
            num_ticks=num_ticks,
            ax_style_top=ax_style_top,
            ax_style_bottom=ax_style_bottom,
            ax_style_y=None,
            show_y_right=show_y_right,
            show_y_left=show_y_left,
        )
        self.ax_right.set_yticks([])

        self.selection_time_range: tuple[pd.Timestamp, pd.Timestamp] | None = None

        self.info_text: AnchoredText | None = None
        self.info_text_loc: str = "upper right"
        self.show_value_left: bool = show_value_left
        self.show_value_right: bool = show_value_right
        self.mode: str | Literal["line", "scatter", "area"] = mode

        self.tmin: np.datetime64 | None = None
        self.tmax: np.datetime64 | None = None

    def _set_info_text_loc(self: Self, info_text_loc: str | None) -> None:
        if isinstance(info_text_loc, str):
            self.info_text_loc = info_text_loc

    def _set_axes(
        self: Self,
        tmin: np.datetime64,
        tmax: np.datetime64,
        vmin: float | None,
        vmax: float | None,
        time: NDArray,
        tmin_original: np.datetime64 | None = None,
        tmax_original: np.datetime64 | None = None,
        longitude: NDArray | None = None,
        latitude: NDArray | None = None,
        ax_style_top: AlongTrackAxisStyle | str | None = None,
        ax_style_bottom: AlongTrackAxisStyle | str | None = None,
    ) -> Self:
        if vmin is not None and not np.isfinite(vmin):
            vmin = None
        if vmax is not None and not np.isfinite(vmax):
            vmax = None
        self.ax.set_ylim((vmin, vmax))  # type: ignore
        self.ax_right.set_ylim(self.ax.get_ylim())

        self.set_grid()

        self._set_time_axes(
            tmin=tmin,
            tmax=tmax,
            time=time,
            tmin_original=tmin_original,
            tmax_original=tmax_original,
            longitude=longitude,
            latitude=latitude,
            ax_style_top=ax_style_top,
            ax_style_bottom=ax_style_bottom,
        )

        return self

    def plot(
        self: Self,
        *,
        values: NDArray | None = None,
        time: NDArray | None = None,
        latitude: NDArray | None = None,
        longitude: NDArray | None = None,
        # Common args for wrappers
        mode: str | Literal["line", "scatter", "area"] | None = None,
        value_range: ValueRangeLike | None = None,
        log_scale: bool | None = None,
        norm: Normalize | None = None,
        time_range: TimeRangeLike | None = None,
        label: str | None = None,
        units: str | None = None,
        color: str | None = Color("ec:blue"),
        alpha: float = 1.0,
        linestyle: str | None = "solid",
        linewidth: float | int | None = 2.0,
        marker: str | None = "s",
        markersize: float | int | None = 2.0,
        selection_time_range: TimeRangeLike | None = None,
        selection_color: str | None = Color("ec:earthcare"),
        selection_linestyle: str | None = "dashed",
        selection_linewidth: float | int | None = 2.5,
        selection_highlight: bool = False,
        selection_highlight_inverted: bool = True,
        selection_highlight_color: str | None = Color("white"),
        selection_highlight_alpha: float = 0.5,
        selection_max_time_margin: (TimedeltaLike | Sequence[TimedeltaLike] | None) = None,
        ax_style_top: AlongTrackAxisStyle | str | None = None,
        ax_style_bottom: AlongTrackAxisStyle | str | None = None,
        classes: Sequence[int] | dict[int, str] | None = None,
        classes_kwargs: dict[str, Any] = {},
        is_prob: bool = False,
        prob_labels: list[str] | None = None,
        prob_colors: list[ColorLike] | None = None,
        zorder: int | float | None = None,
        label_length: int = 20,
        mark_time: TimestampLike | Sequence[TimestampLike] | None = None,
        mark_time_color: (str | Color | Sequence[str | Color | None] | None) = None,
        mark_time_linestyle: str | Sequence[str] = "solid",
        mark_time_linewidth: float | Sequence[float] = 2.5,
        **kwargs,
    ) -> Self:
        self._update(
            selection_color=selection_color,
            selection_linestyle=selection_linestyle,
            selection_linewidth=selection_linewidth,
            selection_highlight=selection_highlight,
            selection_highlight_inverted=selection_highlight_inverted,
            selection_highlight_color=selection_highlight_color,
            selection_highlight_alpha=selection_highlight_alpha,
            mark_time=mark_time,
            mark_time_color=mark_time_color,
            mark_time_linestyle=mark_time_linestyle,
            mark_time_linewidth=mark_time_linewidth,
        )

        _zorder: float = 2.0
        if isinstance(zorder, (int, float)):
            _zorder = float(zorder)

        if isinstance(mode, str):
            if mode in ["line", "scatter", "area"]:
                self.mode = mode
            else:
                raise ValueError(
                    f'invalid `mode` "{mode}", expected either "line", "scatter" or "area"'
                )

        values = np.asarray(values)
        time = np.asarray(time)
        latitude = asarray_or_none(latitude)
        longitude = asarray_or_none(longitude)

        # Validate inputs
        if is_prob:
            if len(values.shape) != 2:
                raise ValueError(
                    f"Since {is_prob=} values must be 2D, but has shape={values.shape}"
                )
        elif len(values.shape) != 1:
            raise ValueError(f"Since {is_prob=} values must be 1D, but has shape={values.shape}")

        tmin_original: np.datetime64 = time[0]
        tmax_original: np.datetime64 = time[-1]

        self._set_norm(
            norm=norm,
            value_range=value_range,
            log_scale=log_scale,
        )
        self._set_selection_max_time_margin(selection_max_time_margin)
        self._set_selection_time_range(selection_time_range)
        time_range = self._get_time_range(time=time, time_range=time_range)
        y_range = self._get_y_range(y=values, y_range=self.value_range)

        self._tmin, self._tmax = time_range
        self._ymin, self._ymax = y_range

        x: NDArray = time
        y: NDArray = values

        if is_prob:
            if label is None:
                label = "Probability"
            plot_stacked_propabilities(
                ax=self._ax,
                probabilities=values,
                time=time,
                labels=prob_labels,
                colors=prob_colors,
                zorder=_zorder,
                ax_label=label,
            )
            self._ymin = 0
            self._ymax = 1
        elif classes is not None:
            _yaxis_position = classes_kwargs.get("yaxis_position", "left")
            _is_left = _yaxis_position == "left"
            _label = format_var_label(label, units, label_len=label_length)

            plot_1d_integer_flag(
                ax=self._ax if _is_left else self._ax_right,
                ax2=self._ax_right if _is_left else self._ax,
                data=y,
                x=x,
                classes=classes,
                ax_label=_label,
                zorder=_zorder,
                **classes_kwargs,
            )
        else:
            color = Color.from_optional(color)
            if "line" in self.mode:
                self._ax.plot(
                    x,
                    y,
                    marker="none",
                    linewidth=linewidth,
                    linestyle=linestyle,
                    color=color,
                    alpha=alpha,
                    zorder=_zorder,
                )
            elif "scatter" in self.mode:
                self._ax.scatter(
                    x,
                    y,
                    marker=marker,
                    s=markersize,
                    color=color,
                    alpha=alpha,
                    zorder=_zorder,
                )
            elif "area" in self.mode:
                self._ax.fill_between(
                    x,
                    [0] * x.shape[0],
                    y,
                    color=color,
                    alpha=alpha,
                    zorder=zorder or 0.0,
                )
            else:
                raise ValueError(f"invalid `mode` {self.mode}")

        self._set_axes(
            tmin=self._tmin,
            tmax=self._tmax,
            vmin=self._ymin,
            vmax=self._ymax,
            time=time,
            tmin_original=tmin_original,
            tmax_original=tmax_original,
            latitude=latitude,
            longitude=longitude,
            ax_style_top=ax_style_top,
            ax_style_bottom=ax_style_bottom,
        )

        if not is_prob and classes is None:
            format_numeric_ticks(
                ax=self._ax,
                axis="y",
                label=format_var_label(label, units, label_len=label_length),
                max_line_length=label_length,
                show_label=self.show_value_left,
                show_values=self.show_value_left,
            )
            format_numeric_ticks(
                ax=self._ax_right,
                axis="y",
                label=format_var_label(label, units, label_len=label_length),
                max_line_length=label_length,
                show_label=self.show_value_right,
                show_values=self.show_value_right,
            )

        self._plot_selection()
        self._plot_time_marks()

        return self

    def ecplot(
        self: Self,
        ds: xr.Dataset,
        var: str,
        *,
        time_var: str = TIME_VAR,
        lat_var: str = TRACK_LAT_VAR,
        lon_var: str = TRACK_LON_VAR,
        along_track_dim: str = ALONG_TRACK_DIM,
        site: SiteLike | None = None,
        radius_km: float = 100.0,
        mark_closest: bool = False,
        show_radius: bool = True,
        show_info: bool = True,
        info_text_loc: str | None = None,
        # Common args for wrappers
        values: NDArray | None = None,
        time: NDArray | None = None,
        latitude: NDArray | None = None,
        longitude: NDArray | None = None,
        mode: str | Literal["line", "scatter", "area"] | None = None,
        value_range: ValueRangeLike | None = None,
        log_scale: bool | None = None,
        norm: Normalize | None = None,
        time_range: TimeRangeLike | None = None,
        label: str | None = None,
        units: str | None = None,
        color: str | None = Color("ec:blue"),
        alpha: float = 1.0,
        linestyle: str | None = "solid",
        linewidth: float | int | None = 2.0,
        marker: str | None = "s",
        markersize: float | int | None = 2.0,
        selection_time_range: TimeRangeLike | None = None,
        selection_color: str | None = Color("ec:earthcare"),
        selection_linestyle: str | None = "dashed",
        selection_linewidth: float | int | None = 2.5,
        selection_highlight: bool = False,
        selection_highlight_inverted: bool = True,
        selection_highlight_color: str | None = Color("white"),
        selection_highlight_alpha: float = 0.5,
        selection_max_time_margin: (TimedeltaLike | Sequence[TimedeltaLike] | None) = None,
        ax_style_top: AlongTrackAxisStyle | str | None = None,
        ax_style_bottom: AlongTrackAxisStyle | str | None = None,
        mark_time: Sequence[TimestampLike] | None = None,
        classes: Sequence[int] | dict[int, str] | None = None,
        classes_kwargs: dict[str, Any] = {},
        is_prob: bool = False,
        prob_labels: list[str] | None = None,
        prob_colors: list[ColorLike] | None = None,
        zorder: int | float | None = None,
        label_length: int = 20,
        **kwargs,
    ) -> Self:
        # Collect all common args for wrapped plot function call
        local_args = locals()

        # Handle deprecated arguments
        def _get_depr_arg(old_name: str, new_name: str) -> Any:
            if old_name in kwargs:
                msg = f"'{old_name}' is deprecated and will be removed in future versions; use '{new_name}' instead."
                warnings.warn(msg, FutureWarning, stacklevel=2)
                out = kwargs.get(old_name, local_args[new_name])
                del kwargs[old_name]
                return out
            return local_args[new_name]

        mark_closest = _get_depr_arg("mark_closest_profile", "mark_closest")
        kwargs["mark_time"] = _get_depr_arg("mark_profiles_at", "mark_time")

        # Delete all args specific to this wrapper function
        del local_args["self"]
        del local_args["ds"]
        del local_args["var"]
        del local_args["time_var"]
        del local_args["lat_var"]
        del local_args["lon_var"]
        del local_args["along_track_dim"]
        del local_args["site"]
        del local_args["radius_km"]
        del local_args["show_info"]
        del local_args["info_text_loc"]
        del local_args["mark_closest"]
        # Delete kwargs to then merge it with the residual common args
        del local_args["kwargs"]
        all_args = {**local_args, **kwargs}

        if all_args["values"] is None:
            all_args["values"] = ds[var].values
        if all_args["time"] is None:
            all_args["time"] = ds[time_var].values
        if all_args["latitude"] is None:
            all_args["latitude"] = ds[lat_var].values
        if all_args["longitude"] is None:
            all_args["longitude"] = ds[lon_var].values

        # Set default values depending on variable name
        if label is None:
            all_args["label"] = "Values" if not hasattr(ds[var], "long_name") else ds[var].long_name
        if units is None:
            all_args["units"] = "-" if not hasattr(ds[var], "units") else ds[var].units
        if classes is not None and len(classes) > 0:
            all_args["value_range"] = (-0.5, len(classes) - 0.5)
        elif value_range is None and log_scale is None and norm is None:
            all_args["norm"] = get_default_norm(var, file_type=ds)

        # Handle overpass
        all_args = self._add_overpass_marks(
            all_args=all_args,
            ds=ds,
            time_var=time_var,
            lat_var=lat_var,
            lon_var=lon_var,
            along_track_dim=along_track_dim,
            site=site,
            radius_km=radius_km,
            mark_closest=mark_closest,
            show_radius=show_radius,
        )

        self.plot(**all_args)

        self._set_info_text_loc(info_text_loc)
        if show_info:
            self.info_text = add_text_product_info(
                self._ax, ds, append_to=self.info_text, loc=self.info_text_loc
            )

        return self

ax property

ax: Axes

The main matplotlib axis of the figure.

colorbar property

colorbar: Colorbar | None

The matplotlib colorbar, if present.

fig property

fig: Figure

The underlying matplotlib figure.

invert_xaxis

invert_xaxis() -> Self

Invert the x-axis.

Source code in earthcarekit/plot/figure/_figure/base.py
def invert_xaxis(self) -> Self:
    """Invert the x-axis."""
    self._ax.invert_xaxis()
    if self._ax_top:
        self._ax_top.invert_xaxis()
    return self

invert_yaxis

invert_yaxis() -> Self

Invert the y-axis.

Source code in earthcarekit/plot/figure/_figure/base.py
def invert_yaxis(self) -> Self:
    """Invert the y-axis."""
    self._ax.invert_yaxis()
    if self._ax_right:
        self._ax_right.invert_yaxis()
    return self

legend property

legend: Legend | None

The matplotlib legend, if present.

remove_colorbar

remove_colorbar() -> None

Remove the colorbar from the figure, if present.

Source code in earthcarekit/plot/figure/_figure/base.py
def remove_colorbar(self) -> None:
    """Remove the colorbar from the figure, if present."""
    if self._colorbar:
        self._colorbar.remove()
        self._colorbar = None

remove_legend

remove_legend() -> None

Remove the legend from the figure, if present.

Source code in earthcarekit/plot/figure/_figure/base.py
def remove_legend(self) -> None:
    """Remove the legend from the figure, if present."""
    if self._legend:
        self._legend.remove()
        self._legend = None

save

save(
    filename: str = "",
    filepath: str | None = None,
    ds: Dataset | None = None,
    ds_filepath: str | None = None,
    dpi: float | Literal["figure"] = "figure",
    orbit_and_frame: str | None = None,
    utc_timestamp: TimestampLike | None = None,
    use_utc_creation_timestamp: bool = False,
    site_name: str | None = None,
    hmax: int | float | None = None,
    radius: int | float | None = None,
    extra: str | None = None,
    transparent_outside: bool = False,
    verbose: bool = True,
    print_prefix: str = "",
    create_dirs: bool = False,
    transparent_background: bool = False,
    resolution: str | None = None,
    **kwargs
) -> None

Save a figure as an image or vector graphic to a file and optionally format the file name in a structured way using EarthCARE metadata.

Parameters:

Name Type Description Default
filename str

The base name of the file. Can be extended based on other metadata provided. Defaults to empty string.

''
filepath str | None

The path where the image is saved. Can be extended based on other metadata provided. Defaults to None.

None
ds Dataset | None

A EarthCARE dataset from which metadata will be taken. Defaults to None.

None
ds_filepath str | None

A path to a EarthCARE product from which metadata will be taken. Defaults to None.

None
dpi float | figure

The resolution in dots per inch. If 'figure', use the figure's dpi value. Defaults to None.

'figure'
orbit_and_frame str | None

Metadata used in the formatting of the file name. Defaults to None.

None
utc_timestamp TimestampLike | None

Metadata used in the formatting of the file name. Defaults to None.

None
use_utc_creation_timestamp bool

Whether the time of image creation should be included in the file name. Defaults to False.

False
site_name str | None

Metadata used in the formatting of the file name. Defaults to None.

None
hmax int | float | None

Metadata used in the formatting of the file name. Defaults to None.

None
radius int | float | None

Metadata used in the formatting of the file name. Defaults to None.

None
resolution str | None

Metadata used in the formatting of the file name. Defaults to None.

None
extra str | None

A custom string to be included in the file name. Defaults to None.

None
transparent_outside bool

Whether the area outside figures should be transparent. Defaults to False.

False
verbose bool

Whether the progress of image creation should be printed to the console. Defaults to True.

True
print_prefix str

A prefix string to all console messages. Defaults to "".

''
create_dirs bool

Whether images should be saved in a folder structure based on provided metadata. Defaults to False.

False
transparent_background bool

Whether the background inside and outside of figures should be transparent. Defaults to False.

False
**kwargs dict[str, Any]

Keyword arguments passed to wrapped function call of matplotlib.pyplot.savefig.

{}
Source code in earthcarekit/plot/figure/_figure/base.py
def save(
    self: Self,
    filename: str = "",
    filepath: str | None = None,
    ds: xr.Dataset | None = None,
    ds_filepath: str | None = None,
    dpi: float | Literal["figure"] = "figure",
    orbit_and_frame: str | None = None,
    utc_timestamp: TimestampLike | None = None,
    use_utc_creation_timestamp: bool = False,
    site_name: str | None = None,
    hmax: int | float | None = None,
    radius: int | float | None = None,
    extra: str | None = None,
    transparent_outside: bool = False,
    verbose: bool = True,
    print_prefix: str = "",
    create_dirs: bool = False,
    transparent_background: bool = False,
    resolution: str | None = None,
    **kwargs,
) -> None:
    """Save a figure as an image or vector graphic to a file and optionally
    format the file name in a structured way using EarthCARE metadata.

    Args:
        filename (str, optional):
            The base name of the file. Can be extended based on other metadata provided.
            Defaults to empty string.
        filepath (str | None, optional):
            The path where the image is saved. Can be extended based on other metadata
            provided. Defaults to None.
        ds (xr.Dataset | None, optional):
            A EarthCARE dataset from which metadata will be taken. Defaults to None.
        ds_filepath (str | None, optional):
            A path to a EarthCARE product from which metadata will be taken. Defaults to None.
        dpi (float | 'figure', optional):
            The resolution in dots per inch. If 'figure', use the figure's dpi value.
            Defaults to None.
        orbit_and_frame (str | None, optional):
            Metadata used in the formatting of the file name. Defaults to None.
        utc_timestamp (TimestampLike | None, optional):
            Metadata used in the formatting of the file name. Defaults to None.
        use_utc_creation_timestamp (bool, optional):
            Whether the time of image creation should be included in the file name.
            Defaults to False.
        site_name (str | None, optional):
            Metadata used in the formatting of the file name. Defaults to None.
        hmax (int | float | None, optional):
            Metadata used in the formatting of the file name. Defaults to None.
        radius (int | float | None, optional):
            Metadata used in the formatting of the file name. Defaults to None.
        resolution (str | None, optional):
            Metadata used in the formatting of the file name. Defaults to None.
        extra (str | None, optional):
            A custom string to be included in the file name. Defaults to None.
        transparent_outside (bool, optional):
            Whether the area outside figures should be transparent. Defaults to False.
        verbose (bool, optional):
            Whether the progress of image creation should be printed to the console.
            Defaults to True.
        print_prefix (str, optional):
            A prefix string to all console messages. Defaults to "".
        create_dirs (bool, optional):
            Whether images should be saved in a folder structure based on provided metadata.
            Defaults to False.
        transparent_background (bool, optional):
            Whether the background inside and outside of figures should be transparent.
            Defaults to False.
        **kwargs (dict[str, Any]):
            Keyword arguments passed to wrapped function call of `matplotlib.pyplot.savefig`.
    """
    save_plot(
        fig=self.fig,
        filename=filename,
        filepath=filepath,
        ds=ds,
        ds_filepath=ds_filepath,
        dpi=dpi,
        orbit_and_frame=orbit_and_frame,
        utc_timestamp=utc_timestamp,
        use_utc_creation_timestamp=use_utc_creation_timestamp,
        site_name=site_name,
        hmax=hmax,
        radius=radius,
        extra=extra,
        transparent_outside=transparent_outside,
        verbose=verbose,
        print_prefix=print_prefix,
        create_dirs=create_dirs,
        transparent_background=transparent_background,
        resolution=resolution,
        **kwargs,
    )

set_colorbar_tick_scale

set_colorbar_tick_scale(
    multiplier: float | None = None, fontsize: float | str | None = None
) -> Self

Configure the scale of the colorbar tick lables, if present.

Source code in earthcarekit/plot/figure/_figure/base.py
def set_colorbar_tick_scale(
    self: Self,
    multiplier: float | None = None,
    fontsize: float | str | None = None,
) -> Self:
    """Configure the scale of the colorbar tick lables, if present."""
    if not isinstance(self._colorbar, Colorbar) or (multiplier is None and fontsize is None):
        return self

    if fontsize is None:
        ticklabels = self._colorbar.ax.yaxis.get_ticklabels()
        if len(ticklabels) == 0:
            ticklabels = self._colorbar.ax.xaxis.get_ticklabels()
        if len(ticklabels) == 0:
            return self
        fontsize = ticklabels[0].get_fontsize()

    if isinstance(fontsize, str):
        fontsize = font_manager.FontProperties(size=fontsize).get_size_in_points()

    if multiplier is not None:
        fontsize *= multiplier

    self._colorbar.ax.tick_params(labelsize=fontsize)

    return self

set_grid

set_grid(
    visible: bool | None = None,
    which: Literal["major", "minor", "both"] | None = None,
    axis: Literal["both", "x", "y"] | None = None,
    color: ColorLike | None = None,
    alpha: float = 1.0,
    linestyle: LineStyleType | None = None,
    linewidth: float | None = None,
    **kwargs
) -> Self

Configure the grid lines of the main matplotlib axis.

Source code in earthcarekit/plot/figure/_figure/base.py
def set_grid(
    self: Self,
    visible: bool | None = None,
    which: Literal["major", "minor", "both"] | None = None,
    axis: Literal["both", "x", "y"] | None = None,
    color: ColorLike | None = None,
    alpha: float = 1.0,
    linestyle: LineStyleType | None = None,
    linewidth: float | None = None,
    **kwargs,
) -> Self:
    """Configure the grid lines of the main matplotlib axis."""
    update_if_not_none(
        d=self._grid_kwargs,
        updates=dict(
            visible=visible,
            which=which,
            axis=axis,
            color=Color.from_optional(color),
            alpha=alpha,
            linestyle=linestyle,
            linewidth=linewidth,
            **kwargs,
        ),
    )

    self._ax.grid(**self._grid_kwargs)

    return self

set_legend

set_legend(
    ax: Axes | None = None,
    loc: str | None = None,
    markerscale: float | None = None,
    frameon: bool | None = None,
    facecolor: ColorLike | None = None,
    edgecolor: ColorLike | None = None,
    framealpha: float | None = None,
    fancybox: bool | None = None,
    handlelength: float | None = None,
    handletextpad: float | None = None,
    borderaxespad: float | None = None,
    ncols: int | None = None,
    edgewidth: float | None = None,
    textcolor: ColorLike | None = None,
    textweight: int | str | None = None,
    textshadealpha: float | None = None,
    textshadewidth: float | None = None,
    textshadecolor: ColorLike | None = None,
    **kwargs
) -> Self

Configure the legend.

If no axis is given and a right-side axis is present (ax_right), the legend is attached to it so that it renders above all plot elements; otherwise, the main axis is used (ax).

Source code in earthcarekit/plot/figure/_figure/base.py
def set_legend(
    self: Self,
    ax: Axes | None = None,
    loc: str | None = None,
    markerscale: float | None = None,
    frameon: bool | None = None,
    facecolor: ColorLike | None = None,
    edgecolor: ColorLike | None = None,
    framealpha: float | None = None,
    fancybox: bool | None = None,
    handlelength: float | None = None,
    handletextpad: float | None = None,
    borderaxespad: float | None = None,
    ncols: int | None = None,
    edgewidth: float | None = None,
    textcolor: ColorLike | None = None,
    textweight: int | str | None = None,
    textshadealpha: float | None = None,
    textshadewidth: float | None = None,
    textshadecolor: ColorLike | None = None,
    **kwargs,
) -> Self:
    """Configure the legend.

    If no axis is given and a right-side axis is present (`ax_right`), the legend is attached
    to it so that it renders above all plot elements; otherwise, the main axis is used (`ax`).
    """
    self.remove_legend()

    update_if_not_none(
        d=self._legend_kwargs,
        updates=dict(
            loc=loc,
            markerscale=markerscale,
            frameon=frameon,
            facecolor=Color.from_optional(facecolor),
            edgecolor=Color.from_optional(edgecolor),
            framealpha=framealpha,
            fancybox=fancybox,
            handlelength=handlelength,
            handletextpad=handletextpad,
            borderaxespad=borderaxespad,
            ncols=ncols,
            **kwargs,
        ),
    )
    update_if_not_none(
        d=self._legend_style_kwargs,
        updates=dict(
            textcolor=Color.from_optional(textcolor),
            textweight=textweight,
            textshadealpha=textshadealpha,
            textshadewidth=textshadewidth,
            textshadecolor=Color.from_optional(textshadecolor),
            edgewidth=edgewidth,
        ),
    )

    _textcolor = self._legend_style_kwargs.get("textcolor", "black")
    _textweight = self._legend_style_kwargs.get("textweight", "normal")
    _textshadealpha = self._legend_style_kwargs.get("textshadealpha", 0.0)
    _textshadewidth = self._legend_style_kwargs.get("textshadewidth", 3.0)
    _textshadecolor = self._legend_style_kwargs.get("textshadecolor", "white")
    _edgewidth = self._legend_style_kwargs.get("edgewidth", 1.5)

    if len(self._legend_handles) > 0:
        _ax = ax or self._ax_right or self._ax
        self._legend = _ax.legend(
            self._legend_handles,
            self._legend_labels,
            **self._legend_kwargs,
            handler_map={tuple: HandlerTuple(ndivide=1)},
        )
        self._legend.get_frame().set_linewidth(_edgewidth)
        for text in self._legend.get_texts():
            text.set_color(_textcolor)
            text.set_fontweight(_textweight)

            if _textshadealpha > 0:
                text = add_shade_to_text(
                    text,
                    alpha=_textshadealpha,
                    linewidth=_textshadewidth,
                    color=_textshadecolor,
                )
    return self

show

show() -> None

Display figure in interactive frontends (e.g., IPython/jupyter notebooks).

Source code in earthcarekit/plot/figure/_figure/base.py
def show(self) -> None:
    """Display figure in interactive frontends (e.g., `IPython`/`jupyter` notebooks)."""
    import IPython
    from IPython.display import display

    if IPython.get_ipython() is not None:
        display(self.fig)
    else:
        plt.show()

show_legend

show_legend(*args, **kwargs) -> Self

Configure the legend.

Deprecated

Use set_legend() instead.

Source code in earthcarekit/plot/figure/_figure/base.py
def show_legend(self: Self, *args, **kwargs) -> Self:
    """Configure the legend.

    Deprecated:
        Use `set_legend()` instead.
    """
    import warnings

    warnings.warn(
        "'show_legend()' is deprecated; use 'set_legend()' instead.",
        DeprecationWarning,
        stacklevel=2,
    )
    return self.set_legend(*args, **kwargs)

to_texture

to_texture() -> Self

Convert the figure to a texture (i.e., remove all axis ticks, labels, annotations, and text).

Source code in earthcarekit/plot/figure/_figure/base.py
def to_texture(self) -> Self:
    """Convert the figure to a texture
    (i.e., remove all axis ticks, labels, annotations, and text).
    """
    for ax in (self._ax, self._ax_top, self._ax_right):
        remove_arists(ax)
        remove_axis_grid_ticks_labels(ax)

    remove_white_frame_around_figure(self.fig)
    remove_colorbar(self._colorbar)
    remove_legend(self._legend)

    return self

MapFigure

Bases: BaseFigure

Figure object for displaying EarthCARE satellite track and/or imager swaths on a global map.

This class sets up a georeferenced map canvas using a range of cartographic projections and visual styles. It serves as the basis for plotting 2D swath data (e.g., from MSI) or simple satellite tracks, optionally with info labels, backgrounds, and other styling options.

Parameters:

Name Type Description Default
ax Axes | None

Existing matplotlib axes to plot on; if not provided, new axes will be created. Defaults to None.

None
figsize tuple[float, float]

Figure size in inches. Defaults to (FIGURE_MAP_WIDTH, FIGURE_MAP_HEIGHT).

(FIGURE_MAP_WIDTH, FIGURE_MAP_HEIGHT)
dpi int | None

Resolution of the figure in dots per inch. Defaults to None.

None
title str | None

Title to display on the map. Defaults to None.

None
style str | Literal['none', 'stock_img', 'gray', 'osm', 'satellite', 'mtg', 'msg', 'blue_marble', 'land_ocean', 'land_ocean_lakes_rivers']

Style of the map's background image. Defaults to "gray".

'gray'
projection str | Projection

Map projection to use; options include "platecarree", "perspective", "orthographic", or a custom cartopy.crs.Projection. Defaults to ccrs.Orthographic().

'orthographic'
central_latitude float | None

Latitude at the center of the projection. Defaults to None.

None
central_longitude float | None

Longitude at the center of the projection. Defaults to None.

0.0
grid_color ColorLike | None

Color of grid lines. Defaults to None.

None
border_color ColorLike | None

Color of border box around the map. Defaults to None.

None
coastline_color ColorLike | None

Color of coastlines. Defaults to None.

None
show_grid bool

Whether to show latitude/longitude grid lines. Defaults to True.

True
show_top_labels bool

Whether to show tick labels on the top axis. Defaults to True.

True
show_bottom_labels bool

Whether to show tick labels on the bottom axis. Defaults to True.

True
show_right_labels bool

Whether to show tick labels on the right axis. Defaults to True.

True
show_left_labels bool

Whether to show tick labels on the left axis. Defaults to True.

True
show_text_time bool

Whether to display a datetime info text above the plot. Defaults to True.

True
show_text_frame bool

Whether to display a EarthCARE frame info text above the plot. Defaults to True.

True
show_text_overpass bool

Whether to display ground site overpass info in the plot. Defaults to True.

True
show_night_shade bool

Whether to overlay the nighttime shading based on timestamp. Defaults to True.

True
timestamp TimestampLike | None

Time reference used for nightshade overlay. Defaults to None.

None
extent Iterable | None

Map extent given as [lon_min, lon_max, lat_min, lat_max]; overrides auto zoom. Defaults to None.

None
lod int | None

Level of detail for choosen background map style image; higher values increase complexity. Defaults to None (meaning automatic selection).

None
coastlines_resolution str

Resolution of coastlines to display; options are "10m", "50m", or "110m". Defaults to "110m".

'110m'
azimuth float

Rotation of the cartopy.crs.ObliqueMercator projection, in degrees (if used). Defaults to 0.

0
pad float | list[float]

Padding applied when selecting a map extent. Defaults to 0.05.

0.05
background_alpha float

Transparency level of the background map style. Defaults to 1.0.

1.0
Source code in earthcarekit/plot/figure/map.py
 387
 388
 389
 390
 391
 392
 393
 394
 395
 396
 397
 398
 399
 400
 401
 402
 403
 404
 405
 406
 407
 408
 409
 410
 411
 412
 413
 414
 415
 416
 417
 418
 419
 420
 421
 422
 423
 424
 425
 426
 427
 428
 429
 430
 431
 432
 433
 434
 435
 436
 437
 438
 439
 440
 441
 442
 443
 444
 445
 446
 447
 448
 449
 450
 451
 452
 453
 454
 455
 456
 457
 458
 459
 460
 461
 462
 463
 464
 465
 466
 467
 468
 469
 470
 471
 472
 473
 474
 475
 476
 477
 478
 479
 480
 481
 482
 483
 484
 485
 486
 487
 488
 489
 490
 491
 492
 493
 494
 495
 496
 497
 498
 499
 500
 501
 502
 503
 504
 505
 506
 507
 508
 509
 510
 511
 512
 513
 514
 515
 516
 517
 518
 519
 520
 521
 522
 523
 524
 525
 526
 527
 528
 529
 530
 531
 532
 533
 534
 535
 536
 537
 538
 539
 540
 541
 542
 543
 544
 545
 546
 547
 548
 549
 550
 551
 552
 553
 554
 555
 556
 557
 558
 559
 560
 561
 562
 563
 564
 565
 566
 567
 568
 569
 570
 571
 572
 573
 574
 575
 576
 577
 578
 579
 580
 581
 582
 583
 584
 585
 586
 587
 588
 589
 590
 591
 592
 593
 594
 595
 596
 597
 598
 599
 600
 601
 602
 603
 604
 605
 606
 607
 608
 609
 610
 611
 612
 613
 614
 615
 616
 617
 618
 619
 620
 621
 622
 623
 624
 625
 626
 627
 628
 629
 630
 631
 632
 633
 634
 635
 636
 637
 638
 639
 640
 641
 642
 643
 644
 645
 646
 647
 648
 649
 650
 651
 652
 653
 654
 655
 656
 657
 658
 659
 660
 661
 662
 663
 664
 665
 666
 667
 668
 669
 670
 671
 672
 673
 674
 675
 676
 677
 678
 679
 680
 681
 682
 683
 684
 685
 686
 687
 688
 689
 690
 691
 692
 693
 694
 695
 696
 697
 698
 699
 700
 701
 702
 703
 704
 705
 706
 707
 708
 709
 710
 711
 712
 713
 714
 715
 716
 717
 718
 719
 720
 721
 722
 723
 724
 725
 726
 727
 728
 729
 730
 731
 732
 733
 734
 735
 736
 737
 738
 739
 740
 741
 742
 743
 744
 745
 746
 747
 748
 749
 750
 751
 752
 753
 754
 755
 756
 757
 758
 759
 760
 761
 762
 763
 764
 765
 766
 767
 768
 769
 770
 771
 772
 773
 774
 775
 776
 777
 778
 779
 780
 781
 782
 783
 784
 785
 786
 787
 788
 789
 790
 791
 792
 793
 794
 795
 796
 797
 798
 799
 800
 801
 802
 803
 804
 805
 806
 807
 808
 809
 810
 811
 812
 813
 814
 815
 816
 817
 818
 819
 820
 821
 822
 823
 824
 825
 826
 827
 828
 829
 830
 831
 832
 833
 834
 835
 836
 837
 838
 839
 840
 841
 842
 843
 844
 845
 846
 847
 848
 849
 850
 851
 852
 853
 854
 855
 856
 857
 858
 859
 860
 861
 862
 863
 864
 865
 866
 867
 868
 869
 870
 871
 872
 873
 874
 875
 876
 877
 878
 879
 880
 881
 882
 883
 884
 885
 886
 887
 888
 889
 890
 891
 892
 893
 894
 895
 896
 897
 898
 899
 900
 901
 902
 903
 904
 905
 906
 907
 908
 909
 910
 911
 912
 913
 914
 915
 916
 917
 918
 919
 920
 921
 922
 923
 924
 925
 926
 927
 928
 929
 930
 931
 932
 933
 934
 935
 936
 937
 938
 939
 940
 941
 942
 943
 944
 945
 946
 947
 948
 949
 950
 951
 952
 953
 954
 955
 956
 957
 958
 959
 960
 961
 962
 963
 964
 965
 966
 967
 968
 969
 970
 971
 972
 973
 974
 975
 976
 977
 978
 979
 980
 981
 982
 983
 984
 985
 986
 987
 988
 989
 990
 991
 992
 993
 994
 995
 996
 997
 998
 999
1000
1001
1002
1003
1004
1005
1006
1007
1008
1009
1010
1011
1012
1013
1014
1015
1016
1017
1018
1019
1020
1021
1022
1023
1024
1025
1026
1027
1028
1029
1030
1031
1032
1033
1034
1035
1036
1037
1038
1039
1040
1041
1042
1043
1044
1045
1046
1047
1048
1049
1050
1051
1052
1053
1054
1055
1056
1057
1058
1059
1060
1061
1062
1063
1064
1065
1066
1067
1068
1069
1070
1071
1072
1073
1074
1075
1076
1077
1078
1079
1080
1081
1082
1083
1084
1085
1086
1087
1088
1089
1090
1091
1092
1093
1094
1095
1096
1097
1098
1099
1100
1101
1102
1103
1104
1105
1106
1107
1108
1109
1110
1111
1112
1113
1114
1115
1116
1117
1118
1119
1120
1121
1122
1123
1124
1125
1126
1127
1128
1129
1130
1131
1132
1133
1134
1135
1136
1137
1138
1139
1140
1141
1142
1143
1144
1145
1146
1147
1148
1149
1150
1151
1152
1153
1154
1155
1156
1157
1158
1159
1160
1161
1162
1163
1164
1165
1166
1167
1168
1169
1170
1171
1172
1173
1174
1175
1176
1177
1178
1179
1180
1181
1182
1183
1184
1185
1186
1187
1188
1189
1190
1191
1192
1193
1194
1195
1196
1197
1198
1199
1200
1201
1202
1203
1204
1205
1206
1207
1208
1209
1210
1211
1212
1213
1214
1215
1216
1217
1218
1219
1220
1221
1222
1223
1224
1225
1226
1227
1228
1229
1230
1231
1232
1233
1234
1235
1236
1237
1238
1239
1240
1241
1242
1243
1244
1245
1246
1247
1248
1249
1250
1251
1252
1253
1254
1255
1256
1257
1258
1259
1260
1261
1262
1263
1264
1265
1266
1267
1268
1269
1270
1271
1272
1273
1274
1275
1276
1277
1278
1279
1280
1281
1282
1283
1284
1285
1286
1287
1288
1289
1290
1291
1292
1293
1294
1295
1296
1297
1298
1299
1300
1301
1302
1303
1304
1305
1306
1307
1308
1309
1310
1311
1312
1313
1314
1315
1316
1317
1318
1319
1320
1321
1322
1323
1324
1325
1326
1327
1328
1329
1330
1331
1332
1333
1334
1335
1336
1337
1338
1339
1340
1341
1342
1343
1344
1345
1346
1347
1348
1349
1350
1351
1352
1353
1354
1355
1356
1357
1358
1359
1360
1361
1362
1363
1364
1365
1366
1367
1368
1369
1370
1371
1372
1373
1374
1375
1376
1377
1378
1379
1380
1381
1382
1383
1384
1385
1386
1387
1388
1389
1390
1391
1392
1393
1394
1395
1396
1397
1398
1399
1400
1401
1402
1403
1404
1405
1406
1407
1408
1409
1410
1411
1412
1413
1414
1415
1416
1417
1418
1419
1420
1421
1422
1423
1424
1425
1426
1427
1428
1429
1430
1431
1432
1433
1434
1435
1436
1437
1438
1439
1440
1441
1442
1443
1444
1445
1446
1447
1448
1449
1450
1451
1452
1453
1454
1455
1456
1457
1458
1459
1460
1461
1462
1463
1464
1465
1466
1467
1468
1469
1470
1471
1472
1473
1474
1475
1476
1477
1478
1479
1480
1481
1482
1483
1484
1485
1486
1487
1488
1489
1490
1491
1492
1493
1494
1495
1496
1497
1498
1499
1500
1501
1502
1503
1504
1505
1506
1507
1508
1509
1510
1511
1512
1513
1514
1515
1516
1517
1518
1519
1520
1521
1522
1523
1524
1525
1526
1527
1528
1529
1530
1531
1532
1533
1534
1535
1536
1537
1538
1539
1540
1541
1542
1543
1544
1545
1546
1547
1548
1549
1550
1551
1552
1553
1554
1555
1556
1557
1558
1559
1560
1561
1562
1563
1564
1565
1566
1567
1568
1569
1570
1571
1572
1573
1574
1575
1576
1577
1578
1579
1580
1581
1582
1583
1584
1585
1586
1587
1588
1589
1590
1591
1592
1593
1594
1595
1596
1597
1598
1599
1600
1601
1602
1603
1604
1605
1606
1607
1608
1609
1610
1611
1612
1613
1614
1615
1616
1617
1618
1619
1620
1621
1622
1623
1624
1625
1626
1627
1628
1629
1630
1631
1632
1633
1634
1635
1636
1637
1638
1639
1640
1641
1642
1643
1644
1645
1646
1647
1648
1649
1650
1651
1652
1653
1654
1655
1656
1657
1658
1659
1660
1661
1662
1663
1664
1665
1666
1667
1668
1669
1670
1671
1672
1673
1674
1675
1676
1677
1678
1679
1680
1681
1682
1683
1684
1685
1686
1687
1688
1689
1690
1691
1692
1693
1694
1695
1696
1697
1698
1699
1700
1701
1702
1703
1704
1705
1706
1707
1708
1709
1710
1711
1712
1713
1714
1715
1716
1717
1718
1719
1720
1721
1722
1723
1724
1725
1726
1727
1728
1729
1730
1731
1732
1733
1734
1735
1736
1737
1738
1739
1740
1741
1742
1743
1744
1745
1746
1747
1748
1749
1750
1751
1752
1753
1754
1755
1756
1757
1758
1759
1760
1761
1762
1763
1764
1765
1766
1767
1768
1769
1770
1771
1772
1773
1774
1775
1776
1777
1778
1779
1780
1781
1782
1783
1784
1785
1786
1787
1788
1789
1790
1791
1792
1793
1794
1795
1796
1797
1798
1799
1800
1801
1802
1803
1804
1805
1806
1807
1808
1809
1810
1811
1812
1813
1814
1815
1816
1817
1818
1819
1820
1821
1822
1823
1824
1825
1826
1827
1828
1829
1830
1831
1832
1833
1834
1835
1836
1837
1838
1839
1840
1841
1842
1843
1844
1845
1846
1847
1848
1849
1850
1851
1852
1853
1854
1855
1856
1857
1858
1859
1860
1861
1862
1863
1864
1865
1866
1867
1868
1869
1870
1871
1872
1873
1874
1875
1876
1877
1878
1879
1880
1881
1882
1883
1884
1885
1886
1887
1888
1889
1890
1891
1892
1893
1894
1895
1896
1897
1898
1899
1900
1901
1902
1903
1904
1905
1906
1907
1908
1909
1910
1911
1912
1913
1914
1915
1916
1917
1918
1919
1920
1921
1922
1923
1924
1925
1926
1927
1928
1929
1930
1931
1932
1933
1934
1935
1936
1937
1938
1939
1940
1941
1942
1943
1944
1945
1946
1947
1948
1949
1950
1951
1952
1953
1954
1955
1956
1957
1958
1959
1960
1961
1962
1963
1964
1965
1966
1967
1968
1969
1970
1971
1972
1973
1974
1975
1976
1977
1978
1979
1980
1981
1982
1983
1984
1985
1986
1987
1988
1989
1990
1991
1992
1993
1994
1995
1996
1997
1998
1999
2000
2001
2002
2003
2004
2005
2006
2007
2008
2009
2010
2011
2012
2013
2014
2015
2016
2017
2018
2019
2020
2021
2022
2023
2024
2025
2026
2027
2028
2029
2030
2031
2032
2033
2034
2035
2036
2037
2038
2039
2040
2041
2042
class MapFigure(BaseFigure):
    """Figure object for displaying EarthCARE satellite track and/or imager swaths on a global map.

    This class sets up a georeferenced map canvas using a range of cartographic projections and visual styles.
    It serves as the basis for plotting 2D swath data (e.g., from MSI) or simple satellite tracks, optionally
    with info labels, backgrounds, and other styling options.

    Args:
        ax (Axes | None, optional): Existing matplotlib axes to plot on; if not provided, new axes will be created. Defaults to None.
        figsize (tuple[float, float], optional): Figure size in inches. Defaults to (FIGURE_MAP_WIDTH, FIGURE_MAP_HEIGHT).
        dpi (int | None, optional): Resolution of the figure in dots per inch. Defaults to None.
        title (str | None, optional): Title to display on the map. Defaults to None.
        style (str | Literal["none", "stock_img", "gray", "osm", "satellite", "mtg", "msg", "blue_marble", "land_ocean", "land_ocean_lakes_rivers"], optional):
            Style of the map's background image. Defaults to "gray".
        projection (str | Projection, optional): Map projection to use; options include "platecarree", "perspective", "orthographic", or a custom `cartopy.crs.Projection`. Defaults to `ccrs.Orthographic()`.
        central_latitude (float | None, optional): Latitude at the center of the projection. Defaults to None.
        central_longitude (float | None, optional): Longitude at the center of the projection. Defaults to None.
        grid_color (ColorLike | None, optional): Color of grid lines. Defaults to None.
        border_color (ColorLike | None, optional): Color of border box around the map. Defaults to None.
        coastline_color (ColorLike | None, optional): Color of coastlines. Defaults to None.
        show_grid (bool, optional): Whether to show latitude/longitude grid lines. Defaults to True.
        show_top_labels (bool, optional): Whether to show tick labels on the top axis. Defaults to True.
        show_bottom_labels (bool, optional): Whether to show tick labels on the bottom axis. Defaults to True.
        show_right_labels (bool, optional): Whether to show tick labels on the right axis. Defaults to True.
        show_left_labels (bool, optional): Whether to show tick labels on the left axis. Defaults to True.
        show_text_time (bool, optional): Whether to display a datetime info text above the plot. Defaults to True.
        show_text_frame (bool, optional): Whether to display a EarthCARE frame info text above the plot. Defaults to True.
        show_text_overpass (bool, optional): Whether to display ground site overpass info in the plot. Defaults to True.
        show_night_shade (bool, optional): Whether to overlay the nighttime shading based on `timestamp`. Defaults to True.
        timestamp (TimestampLike | None, optional): Time reference used for nightshade overlay. Defaults to None.
        extent (Iterable | None, optional): Map extent given as [lon_min, lon_max, lat_min, lat_max]; overrides auto zoom. Defaults to None.
        lod (int | None, optional): Level of detail for choosen background map style image; higher values increase complexity. Defaults to None (meaning automatic selection).
        coastlines_resolution (str, optional): Resolution of coastlines to display; options are "10m", "50m", or "110m". Defaults to "110m".
        azimuth (float, optional): Rotation of the `cartopy.crs.ObliqueMercator` projection, in degrees (if used). Defaults to 0.
        pad (float | list[float], optional): Padding applied when selecting a map extent. Defaults to 0.05.
        background_alpha (float, optional): Transparency level of the background map style. Defaults to 1.0.
    """

    def __init__(
        self: Self,
        ax: Axes | None = None,
        figsize: tuple[float, float] = (FIGURE_MAP_WIDTH, FIGURE_MAP_HEIGHT),
        dpi: int | None = None,
        title: str | None = None,
        style: MapStyleLike = "gray",
        projection: ProjectionLike = "orthographic",
        central_latitude: float | ArrayLike | None = None,
        central_longitude: float | ArrayLike | None = 0.0,
        grid_color: ColorLike | None = None,
        border_color: ColorLike | None = None,
        coastline_color: ColorLike | None = None,
        show_grid: bool | None = True,
        show_grid_labels: bool = True,
        show_geo_labels: bool = True,
        show_top_labels: bool = True,
        show_bottom_labels: bool = True,
        show_right_labels: bool = True,
        show_left_labels: bool = True,
        show_text_time: bool = True,
        show_text_frame: bool = True,
        show_text_overpass: bool = True,
        show_night_shade: bool = True,
        timestamp: TimestampLike | None = None,
        extent: Iterable | None = None,
        lod: int | None = None,
        coastlines_resolution: Literal["10m", "50m", "110m"] = "110m",
        azimuth: float = 0,
        pad: float | list[float] = 0.05,
        background_alpha: float = 1.0,
        colorbar_tick_scale: float | None = None,
        land_color: ColorLike | None = None,
        ocean_color: ColorLike | None = None,
        lakes_color: ColorLike | None = None,
        rivers_color: ColorLike | None = None,
        fig_height_scale: float = 1.0,
        fig_width_scale: float = 1.0,
        axes_rect: tuple[float, float, float, float] = (0.0, 0.0, 1.0, 1.0),
        title_kwargs: dict[str, Any] = {},
    ):
        super().__init__(
            ax=ax,
            figsize=figsize,
            dpi=dpi,
            title=title,
            fig_height_scale=fig_height_scale,
            fig_width_scale=fig_width_scale,
            axes_rect=axes_rect,
            show_grid=show_grid,
            title_kwargs=title_kwargs,
        )

        self.style = style
        self._grid_color = Color.from_optional(grid_color)
        self.border_color = Color.from_optional(border_color)
        self.coastline_color = Color.from_optional(coastline_color)
        self.land_color = Color.from_optional(land_color)
        self.ocean_color = Color.from_optional(ocean_color)
        self.lakes_color = Color.from_optional(lakes_color)
        self.rivers_color = Color.from_optional(rivers_color)
        self.show_grid_labels = show_grid_labels
        self.show_geo_labels = show_grid_labels and show_geo_labels
        self.show_top_labels = show_grid_labels and show_top_labels
        self.show_bottom_labels = show_grid_labels and show_bottom_labels
        self.show_right_labels = show_grid_labels and show_right_labels
        self.show_left_labels = show_grid_labels and show_left_labels
        if (
            not self.show_top_labels
            and not self.show_bottom_labels
            and not self.show_right_labels
            and not self.show_left_labels
        ):
            self.show_grid_labels = False
        self.show_text_time = show_text_time
        self.show_text_frame = show_text_frame
        self.show_text_overpass = show_text_overpass
        if timestamp is not None:
            timestamp = to_timestamp(timestamp)
        self.timestamp = timestamp
        self.extent: list | None = None
        if isinstance(extent, Iterable):
            self.extent = list(extent)

        if central_latitude is not None and central_longitude is not None:
            central_latitude, central_longitude = get_central_coords(
                central_latitude, central_longitude
            )
        else:
            if central_latitude is not None:
                central_latitude = get_central_latitude(central_latitude)
            if central_longitude is not None:
                central_longitude = get_central_longitude(central_longitude)
        self.projection_type, clat, clon = _validate_projection(projection)
        self.central_latitude: float | None = central_latitude
        self.central_longitude: float | None = central_longitude
        if central_latitude is None:
            self.central_latitude = clat
        if central_longitude is None:
            self.central_longitude = clon

        self._inital_lod: int | None = lod
        self.lod: int = 2 if lod is None else lod
        self.coastlines_resolution = coastlines_resolution
        self.azimuth = azimuth
        self.colorbar_tick_scale: float | None = colorbar_tick_scale
        self.pad = _validate_pad(pad)
        self.background_alpha = background_alpha

        self.grid_lines: Gridliner | None = None

        self.show_night_shade = show_night_shade

        with warnings.catch_warnings():
            warnings.simplefilter("ignore", UserWarning)
            self._init_axes()

    def set_view(
        self: Self,
        latitude: ArrayLike,
        longitude: ArrayLike,
        pad: float | Iterable | None = None,
    ) -> Self:
        """
        Fits the plot extent to the given latitude and longitude values.

        Args:
            latitude (ArrayLike): Latitude values.
            longitude (ArrayLike): Longitude values.
            pad (float | Iterable | None, optional):
                Padding or margins around the given lat/lon values.
                The padding is applied relative to the min/max difference along the respective lat/lon extent,
                e.g., `lats=[-5,5]` and `pad=0` -> lat extent=[-5,5], `pad=1` -> lat extent=[-15,15], `pad=2` -> lat extent=[-25,25], etc.
                Can be given as single number or as a 4-element list, i.e., [left/west, right/east, bottom/south, top/north].
                Defaults to None.

        Returns:
            Axes: _description_
        """
        if isinstance(pad, (float | int | Iterable)):
            self.pad = _validate_pad(pad)
        self._ax = set_view(
            self._ax,
            self.projection,
            latitude,
            longitude,
            pad_xmin=self.pad[0],
            pad_xmax=self.pad[1],
            pad_ymin=self.pad[2],
            pad_ymax=self.pad[3],
        )
        return self

    def set_extent(
        self: Self, extent: list | None = None, pad: float | Iterable | None = None
    ) -> Self:
        if isinstance(extent, Iterable):
            self.extent = extent
            self.set_view(
                longitude=np.array(self.extent[0:2]),
                latitude=np.array(self.extent[2:4]),
                pad=pad,
            )
        return self

    def _init_axes(self) -> None:
        if self.projection_type == ccrs.ObliqueMercator:
            if self.central_longitude is None:
                self.central_longitude = 0
            if self.central_latitude is None:
                self.central_latitude = 0

        self.projection = _init_projection(
            projection_type=self.projection_type,
            central_longitude=self.central_longitude,
            central_latitude=self.central_latitude,
            azimuth=self.azimuth,
        )
        self.transform = ccrs.Geodetic()  # ccrs.PlateCarree()

        # making sure axis projection is setup correctly
        if not isinstance(self._ax, Axes):
            self._fig, self._ax = plt.subplots(
                subplot_kw={"projection": self.projection}, figsize=self._figsize
            )
        elif not (
            hasattr(self._ax, "projection") and type(self._ax.projection) is type(self.projection)
        ):
            tmp = self._ax.get_figure()
            if not isinstance(tmp, (Figure, SubFigure)):
                raise ValueError("Invalid Figure")
            self._fig = cast(Figure, tmp)

            pos = self._ax.get_position()
            self._ax.remove()
            self._ax = cast(Axes, self._fig.add_subplot(pos, projection=self.projection))

        # self._ax.set_facecolor("white")
        # self._ax.set_facecolor("none")

        if self._title:
            self._fig.suptitle(self._title)

        self._ax.axis("equal")

        # Earth image
        grid_color = Color("#000000")
        coastline_color = Color("#000000")

        if not isinstance(self.style, str):
            raise TypeError(f"style has wrong type '{type(self.style).__name__}'. Expected 'str'")

        _cfeatures = _get_cfeatures_from_style(self.style)

        if len(_cfeatures) != 0 and not (len(_cfeatures) == 1 and _cfeatures[0] == "gray"):
            with warnings.catch_warnings():
                warnings.simplefilter("ignore", UserWarning)

                if "gray" in _cfeatures:
                    land_color = "#F6F6F6"
                    ocean_color = "#C6C6C6"
                    lakes_color = "#D0D0D0"
                    rivers_color = "#DEDEDE"
                else:
                    land_color = "#F4F3E3"
                    ocean_color = "#B8C9D3"
                    lakes_color = "#C4D1D6"
                    rivers_color = "#D6DEDB"

                if isinstance(self.land_color, Color):
                    land_color = self.land_color.hex
                if isinstance(self.ocean_color, Color):
                    ocean_color = self.ocean_color.hex
                if isinstance(self.lakes_color, Color):
                    lakes_color = self.lakes_color.hex
                if isinstance(self.rivers_color, Color):
                    rivers_color = self.rivers_color.hex

                if "land" in _cfeatures:
                    self._ax.add_feature(  # type: ignore
                        cfeature.LAND.with_scale(self.coastlines_resolution),
                        facecolor=land_color,
                    )
                if "ocean" in _cfeatures:
                    self._ax.add_feature(  # type: ignore
                        cfeature.OCEAN.with_scale(self.coastlines_resolution),
                        facecolor=ocean_color,
                    )
                if "lakes" in _cfeatures:
                    self._ax.add_feature(  # type: ignore
                        cfeature.LAKES.with_scale(self.coastlines_resolution),
                        facecolor=lakes_color,
                    )
                if "rivers" in _cfeatures:
                    self._ax.add_feature(  # type: ignore
                        cfeature.RIVERS.with_scale(self.coastlines_resolution),
                        edgecolor=rivers_color,
                    )
        elif self.style == "none":
            pass
        elif self.style == "stock_img":
            grid_color = Color("#3f4d53")
            coastline_color = Color("#537585")
            self._ax.stock_img()  # type: ignore
        elif self.style == "gray":
            add_gray_stock_img(self._ax)
            grid_color = Color("#6d6d6db3")
            coastline_color = Color("#C0C0C0")
        elif self.style == "osm":
            try:
                request = cimgt.OSM()
                self._ax.add_image(
                    request,
                    self.lod,
                    interpolation="spline36",
                    regrid_shape=2000,
                )  # type: ignore
                grid_color = Color("#6d6d6db3")
                coastline_color = Color("#C0C0C0")
            except Exception as e:
                msg = f"Failed to load OSM tiles, using stock_img as fallback instead.\nOriginal error: {repr(e)}"
                warnings.warn(msg, UserWarning, stacklevel=2)
                self._ax.stock_img()  # type: ignore
        elif self.style == "satellite":
            try:
                request = cimgt.QuadtreeTiles()
                self._ax.add_image(
                    request,
                    self.lod,
                    interpolation="spline36",
                    regrid_shape=2000,
                )  # type: ignore
                grid_color = Color("#C0C0C099")
                coastline_color = Color("#C0C0C099")
            except Exception as e:
                msg = f"Failed to load QuadtreeTiles tiles, using stock_img as fallback instead.\nOriginal error: {repr(e)}"
                warnings.warn(msg, UserWarning, stacklevel=2)
                self._ax.stock_img()  # type: ignore
        elif self.style == "blue_marble":
            try:
                wms = WebMapService(
                    "https://gibs.earthdata.nasa.gov/wms/epsg4326/best/wms.cgi?",
                    version="1.1.1",
                )
                layer = "BlueMarble_ShadedRelief_Bathymetry"
                self._ax.add_wms(wms, layer)  # type: ignore
                grid_color = Color("#C7C7C799")
                coastline_color = Color("#74BBD180")

                width, height = 1024, 512
                white_overlay = np.ones((height, width, 4))
                white_overlay[..., 3] = 0.2

                self._ax.imshow(
                    white_overlay,
                    origin="upper",
                    extent=(-180.0, 180.0, -90.0, 90.0),
                    transform=ccrs.PlateCarree(),
                )
            except Exception as e:
                msg = f"Failed to load BlueMarble_ShadedRelief_Bathymetry tiles, using stock_img as fallback instead.\nOriginal error: {repr(e)}"
                warnings.warn(msg, UserWarning, stacklevel=2)
                self._ax.stock_img()  # type: ignore
        else:
            if not isinstance(self.timestamp, pd.Timestamp):
                msg = f"Missing timestamp for {self.style.upper()} data request for 'https://view.eumetsat.int' (timestamp={self.timestamp})"
                warnings.warn(msg)
            else:
                try:
                    if self.style == "mtg":
                        if self.timestamp < to_timestamp("2024-09-23T02:00"):
                            self.style = "msg"
                            msg = (
                                f"Switching to MSG since MTG is only available from 2024-09-23 02:00 UTC onwards"
                                f"(timestamp given: {time_to_iso(self.timestamp, format='%Y-%m-%d %H:%M:%S')})"
                            )
                            warnings.warn(msg)
                    add_gray_stock_img(self._ax)
                    grid_color = Color("#3f4d53")
                    coastline_color = Color("white").blend(0.5)  # Color("#3f4d53")

                    date_str = (
                        pd.Timestamp(self.timestamp, tz="UTC")
                        .round("h")
                        .isoformat()
                        .replace("+00:00", "Z")
                    )
                    # Connect to NASA GIBS
                    url = "https://view.eumetsat.int/geoserver/ows"

                    wms = WebMapService(url)
                    if self.style == "mtg":
                        layer = "mtg_fd:rgb_geocolour"  # "mtg_fd:ir105_hrfi" #"mumi:worldcloudmap_ir108" #"MODIS_Terra_SurfaceReflectance_Bands143"
                    elif self.style == "msg":
                        layer = "msg_fes:rgb_naturalenhncd"
                    elif self.style == "nasa":
                        wms = WebMapService(
                            "https://gibs.earthdata.nasa.gov/wms/epsg4326/best/wms.cgi?",
                            version="1.1.1",
                        )
                        layer = "MODIS_Terra_CorrectedReflectance_TrueColor"
                    elif "nasa:" in self.style:
                        self.style = self.style.replace("nasa:", "")
                        layer = self.style
                        wms = WebMapService(
                            "https://gibs.earthdata.nasa.gov/wms/epsg4326/best/wms.cgi?",
                            version="1.1.1",
                        )
                    else:
                        layer = self.style
                        # raise NotImplementedError()
                    wms_kwargs = {
                        "time": date_str,
                    }

                    self._ax.add_wms(wms, layer, wms_kwargs=wms_kwargs)  # type: ignore
                except Exception as e:
                    msg = f"Failed to load '{self.style}' tiles, using stock_img as fallback instead.\nOriginal error: {repr(e)}"
                    warnings.warn(msg, UserWarning, stacklevel=2)
                    self._ax.stock_img()  # type: ignore

        # Overlay white transparent layer
        if self.background_alpha < 1.0:
            width, height = 1024, 512
            white_overlay = np.ones((height, width, 4))
            white_overlay[..., 3] = 1 - self.background_alpha

            self._ax.imshow(
                white_overlay,
                origin="upper",
                transform=ccrs.PlateCarree(),
            )
        # else:
        #     raise ValueError(
        #         f'invalid style "{self.style}". Valid styles are: "gray", "osm", "satellite"'
        #     )

        # Grid lines
        _grid_color = self._grid_color
        if _grid_color is None:
            _grid_color = grid_color

        _border_color = self.border_color
        if _border_color is None:
            _border_color = _grid_color

        _coastline_color = self.coastline_color
        if _coastline_color is None:
            _coastline_color = coastline_color

        if self._show_grid:
            self.grid_lines = self._ax.gridlines(  # type: ignore
                draw_labels=True,
                color=_grid_color,
                linewidth=0.5,
                linestyle="dashed",
            )
            self.grid_lines.geo_labels = self.show_geo_labels
            self.grid_lines.top_labels = self.show_top_labels
            self.grid_lines.bottom_labels = self.show_bottom_labels
            self.grid_lines.right_labels = self.show_right_labels
            self.grid_lines.left_labels = self.show_left_labels
        self._ax.add_feature(  # type: ignore
            cfeature.COASTLINE.with_scale(self.coastlines_resolution),
            edgecolor=_coastline_color,
        )
        self._ax.spines["geo"].set_edgecolor(_border_color)

        # Night shade
        if self.timestamp is not None:
            self.timestamp = to_timestamp(self.timestamp)
            if self.show_night_shade:
                night_shade_alpha = 0.15
                night_shade_color = Color("#000000")
                self._ax.add_feature(  # type: ignore
                    Nightshade(
                        self.timestamp,
                        alpha=night_shade_alpha,
                        color=night_shade_color,
                        linewidth=0,
                    )
                )

    def plot_track(
        self: Self,
        latitude: NDArray,
        longitude: NDArray,
        marker: str | None = None,
        markersize: float | int | None = None,
        linestyle: str | None = None,
        linewidth: float | int = 2,
        color: Color | ColorLike | None = None,
        alpha: float | None = 1.0,
        highlight_first: bool = True,
        highlight_first_color: Color | None = None,
        highlight_last: bool = True,
        highlight_last_color: Color | None = None,
        zorder: float = 4,
        z: NDArray | None = None,
        cmap: CmapLike = "viridis",
        value_range: ValueRangeLike | None = None,
        log_scale: bool | None = None,
        norm: Normalize | None = None,
        show_border: bool = False,
        border_linewidth: float = 1,
        border_color="black",
        colorbar: bool = True,
        colorbar_position: str | Literal["left", "right", "top", "bottom"] = "bottom",
        colorbar_alignment: str | Literal["left", "center", "right"] = "center",
        colorbar_width: float = DEFAULT_COLORBAR_WIDTH,
        colorbar_spacing: float = 0.3,
        colorbar_length_ratio: float | str = "100%",
        colorbar_label_outside: bool = True,
        colorbar_ticks_outside: bool = True,
        colorbar_ticks_both: bool = False,
        label: str = "",
        units: str = "",
        line_overlap: int = 20,
    ) -> Self:
        latitude = np.asarray(latitude)
        longitude = np.asarray(longitude)

        if z is not None:
            z = np.asarray(z)
            line_overlap = min(line_overlap, int(len(z) * 0.01))
            cmap, value_range, norm = self._init_cmap(cmap, value_range, log_scale, norm)

            coords = np.column_stack([longitude, latitude])
            segments = [s for s in np.stack([coords[:-1], coords[1:]], axis=1)]
            coords_borders = np.array(
                [coords[0]]
                + [
                    get_coord_between(s[0][::-1], s[1][::-1])[::-1] for s in segments
                ]  # Reverse lon/lat to lat/lon for get_coord_between and back again
                + [coords[-1]] * (line_overlap + 1)
            )
            segments = [s for s in np.stack([coords_borders[:-1], coords_borders[1:]], axis=1)]

            def _stack_points(points, line_overlap):
                n_stacks = line_overlap + 2
                return np.stack(
                    [points[i : len(points) - (n_stacks - 1) + i] for i in range(n_stacks)],
                    axis=1,
                )

            segments = [s for s in _stack_points(coords_borders, line_overlap=line_overlap)]
            z_segments = z

            if show_border:
                _l_border = self._ax.plot(
                    coords[:, 0],
                    coords[:, 1],
                    linestyle="solid",
                    linewidth=linewidth + border_linewidth * 2,
                    transform=self.transform,
                    zorder=zorder,
                    color=border_color,
                    solid_capstyle="butt",
                )

            _lc = LineCollection(
                segments,
                cmap=cmap,
                norm=norm,
                linewidth=linewidth,
                transform=self.transform,
                zorder=zorder,
                antialiased=True,
            )
            _lc.set_array(z_segments)
            self._ax.add_collection(_lc)

            if colorbar and not self._colorbar:
                cb_kwargs = dict(
                    label=format_var_label(label, units),
                    position=colorbar_position,
                    alignment=colorbar_alignment,
                    width=colorbar_width,
                    spacing=colorbar_spacing,
                    length_ratio=colorbar_length_ratio,
                    label_outside=colorbar_label_outside,
                    ticks_outside=colorbar_ticks_outside,
                    ticks_both=colorbar_ticks_both,
                )
                self.set_colorbar(
                    data=_lc,
                    cmap=cmap,
                    **cb_kwargs,  # type: ignore
                )
                self.set_colorbar_tick_scale(multiplier=self.colorbar_tick_scale)

            return self

        color = Color.from_optional(color)
        highlight_first_color = Color.from_optional(highlight_first_color)
        highlight_last_color = Color.from_optional(highlight_last_color)

        _alpha = alpha
        if isinstance(color, Color):
            if _alpha is not None:
                _alpha = _alpha * color.alpha
            else:
                _alpha = color.alpha

        p = self._ax.plot(
            longitude,
            latitude,
            marker=marker,
            markersize=markersize,
            linestyle=linestyle,
            linewidth=linewidth,
            zorder=zorder,
            transform=self.transform,
            color=color,
            alpha=_alpha,
            markeredgewidth=linewidth,
        )
        color = p[0].get_color()  # type: ignore
        if highlight_first_color is None:
            highlight_first_color = color
        if highlight_last_color is None:
            highlight_last_color = color

        _alpha = alpha
        if isinstance(highlight_first_color, Color):
            if _alpha is not None:
                _alpha = _alpha * highlight_first_color.alpha
            else:
                _alpha = highlight_first_color.alpha

        if highlight_first:
            self._ax.plot(
                [longitude[0]],
                [latitude[0]],
                marker="o",
                markersize=markersize,
                linestyle="none",
                zorder=zorder if zorder is not None else 4,
                transform=self.transform,
                color=highlight_first_color,
                alpha=_alpha,
            )

        if highlight_last:
            tmp_i = 0
            for i in range(len(longitude)):
                if (longitude[-1], latitude[-1]) != (
                    longitude[-2 - i],
                    latitude[-2 - i],
                ):
                    tmp_i = -2 - i
                    break
            arrow_style = get_arrow_style(linewidth)
            c1 = (longitude[-1], latitude[-1])
            c2 = (longitude[tmp_i], latitude[tmp_i])
            c3 = tuple(get_coord_between((c1[1], c1[0]), (c2[1], c2[0]), 0.2))
            c3 = (c3[1], c3[0])

            _alpha = alpha
            if isinstance(highlight_last_color, Color):
                if _alpha is not None:
                    _alpha = _alpha * highlight_last_color.alpha
                else:
                    _alpha = highlight_last_color.alpha

            self._ax.annotate(
                "",
                xy=c1,
                xytext=c3,
                transform=self.transform,
                clip_on=True,
                annotation_clip=True,
                arrowprops=dict(
                    arrowstyle=arrow_style,
                    color=highlight_last_color,
                    lw=linewidth,
                    shrinkA=0,
                    shrinkB=0,
                    alpha=_alpha,
                    connectionstyle="arc3,rad=0",
                    mutation_scale=10,
                ),
                zorder=zorder,
            )
        return self

    def plot_text(
        self: Self,
        latitude: int | float,
        longitude: int | float,
        text: str,
        color: Color | ColorLike | None = "black",
        text_side: Literal["left", "right", "center"] = "left",
        zorder: int | float = 8,
        padding: str = "  ",
        rotation: int = 0,
        fontdict: dict[str, Any] | None = None,
        show_shade: bool = True,
        color_shade: Color | ColorLike | None = None,
        alpha_shade: float = 0.8,
    ) -> Self:
        if isinstance(text_side, str):
            if text_side == "center":
                horizontalalignment = "center"
            elif text_side == "left":
                horizontalalignment = "right"
                text = f"{text}{padding}"
            elif text_side == "right":
                horizontalalignment = "left"
                text = f"{padding}{text}"
            else:
                raise ValueError(
                    f'got invalid text_side "{text_side}". expected "left" or "right".'
                )
        else:
            raise TypeError(
                f"""invalid type '{type(text_side).__name__}' for text_side. expected type 'str': "left" or "right"."""
            )

        t = self._ax.text(
            longitude,
            latitude,
            text,
            color=color,
            verticalalignment="center",
            horizontalalignment=horizontalalignment,
            transform=self.transform,
            zorder=zorder,
            clip_on=True,
            rotation=rotation,
            rotation_mode="anchor",
            fontdict=fontdict,
        )
        if show_shade:
            t = add_shade_to_text(
                t,
                color=color_shade,
                alpha=alpha_shade,
            )
        return self

    def plot_point(
        self: Self,
        latitude: int | float,
        longitude: int | float,
        marker: str | None = "D",
        markersize: int | float = 5,
        color: Color | ColorLike | None = "black",
        alpha: float = 1.0,
        edgecolor: Color | ColorLike | None = "white",
        edgealpha: float = 0.8,
        zorder: int | float = 4,
        text: str | None = None,
        text_color: Color | ColorLike | None = "black",
        text_side: Literal["left", "right", "center"] = "right",
        text_zorder: int | float = 8,
        text_padding: str = "  ",
        text_alpha_shade: float = 0.8,
        text_fontdict: dict[str, Any] | None = None,
    ) -> Self:
        _color = Color.from_optional(color, alpha=alpha)
        _edgecolor = Color.from_optional(edgecolor, alpha=edgealpha)
        self._ax.plot(
            [longitude],
            [latitude],
            marker=marker,
            markersize=markersize,
            linestyle="none",
            transform=self.transform,
            color=_color,
            zorder=zorder,
            markerfacecolor=_color,
            markeredgecolor=_edgecolor,
        )
        if isinstance(text, str):
            self.plot_text(
                latitude=latitude,
                longitude=longitude,
                text=text,
                color=text_color,
                text_side=text_side,
                zorder=text_zorder,
                padding=text_padding,
                alpha_shade=text_alpha_shade,
                fontdict=text_fontdict,
            )
        return self

    def plot_radius(
        self: Self,
        latitude: int | float,
        longitude: int | float,
        radius_km: int | float,
        color: Color | ColorLike | None = "#000000",
        face_color: Color | ColorLike | None = "#FFFFFF00",
        edge_color: Color | ColorLike | None = None,
        text_color: Color | ColorLike | None = None,
        point_color: Color | ColorLike | None = None,
        edge_alpha: float = 0.8,
        text: str | None = None,
        text_side: Literal["left", "right"] = "right",
        marker: str | None = "D",
        zorder: int | float = 4,
        text_zorder: int | float = 8,
    ) -> Self:
        _color: Color | None = Color.from_optional(color)
        _face_color = Color.from_optional(face_color) or Color("#FFFFFF00")
        _edge_color = Color.from_optional(edge_color) or _color
        _text_color = Color.from_optional(text_color) or Color("#000000")
        _point_color = Color.from_optional(point_color) or _color
        if isinstance(_edge_color, Color):
            _edge_color = _edge_color.set_alpha(edge_alpha)

        # Draw circle
        # TODO: workaround to avoid annoying warnings, need to change this later!
        with warnings.catch_warnings():
            warnings.filterwarnings("ignore", message="Approximating coordinate system*")
            self._ax.tissot(  # type: ignore
                rad_km=radius_km,
                lons=longitude,
                lats=latitude,
                n_samples=128,
                facecolor=_face_color,
                edgecolor=_edge_color,
                zorder=zorder,
            )  # type: ignore

        # Draw center point
        self.plot_point(
            longitude=longitude,
            latitude=latitude,
            marker=marker,
            markersize=5,
            color=_point_color,
            zorder=zorder,
            text=text,
            text_color=_text_color,
            text_side=text_side,
            text_zorder=text_zorder,
            text_padding="  ",
        )

        return self

    def _plot_overpass(
        self: Self,
        lat_selection: NDArray,
        lon_selection: NDArray,
        lat_total: NDArray,
        lon_total: NDArray,
        site: Site,
        radius_km: int | float,
        site_color: Color | ColorLike | None = "black",
        radius_color: Color | ColorLike | None = None,
        color_selection: Color | ColorLike | None = "ec:earthcare",
        linewidth_selection: float = 3,
        linestyle_selection: str | None = "solid",
        color_total: Color | ColorLike | None = "ec:blue",
        linewidth_total: float = 2.5,
        linestyle_total: str | None = "solid",
        site_text_side: Literal["left", "right"] = "right",
        timestamp: pd.Timestamp | None = None,
        view: Literal["global", "data", "overpass"] = "overpass",
        show_highlights: bool = True,
        show_track: bool = True,
    ) -> Self:
        if radius_color is None:
            if self.style in ["satellite", "blue_marble"]:
                radius_color = "white"
            elif self.style in ["gray"]:
                radius_color = "black"

        lat_selection = np.asarray(lat_selection)
        lon_selection = np.asarray(lon_selection)
        lat_total = np.asarray(lat_total)
        lon_total = np.asarray(lon_total)

        site_lat = site.latitude
        site_lon = site.longitude
        site_name = site.name

        self.central_latitude = site_lat
        self.central_longitude = site_lon

        if view == "overpass":
            if isinstance(self._inital_lod, int):
                self.lod = self._inital_lod
            else:
                self.lod = get_osm_lod(
                    (lat_selection[0], lon_selection[0]),
                    (lat_selection[-1], lon_selection[-1]),
                    distance_km=radius_km * 2,
                )
            self.coastlines_resolution = "10m"
        elif view == "data":
            if isinstance(self._inital_lod, int):
                self.lod = self._inital_lod
            else:
                self.lod = get_osm_lod((lat_total[0], lon_total[0]), (lat_total[-1], lon_total[-1]))
            self.coastlines_resolution = "50m"
        else:
            if isinstance(self._inital_lod, int):
                self.lod = self._inital_lod
            else:
                self.lod = 2
            self.coastlines_resolution = "110m"

        if timestamp is not None:
            self.timestamp = to_timestamp(timestamp)

        pos = self._ax.get_position()
        self._fig.delaxes(self._ax)
        self._ax = self._fig.add_axes(pos)  # type:ignore
        self._init_axes()

        # FIXME: workaround to avoid annoying warnings, need to change this later!
        warnings.filterwarnings("ignore", message="Approximating coordinate system*")
        self.plot_radius(
            latitude=site_lat,
            longitude=site_lon,
            radius_km=radius_km,
            text=site_name,
            text_side=site_text_side,
            color=radius_color,
            point_color=site_color,
            text_color=site_color,
        )

        highlight_last = False if view == "overpass" else True
        if show_track:
            self.plot_track(
                latitude=lat_total,
                longitude=lon_total,
                linewidth=linewidth_total,
                linestyle=linestyle_total,
                highlight_first=show_highlights and False,
                highlight_last=show_highlights and highlight_last,
                color=color_total,
            )
        highlight_first = True if view == "overpass" else False
        highlight_last = True if view == "overpass" else False
        if show_track:
            self.plot_track(
                latitude=lat_selection,
                longitude=lon_selection,
                linewidth=linewidth_selection,
                linestyle=linestyle_selection,
                highlight_first=show_highlights and highlight_first,
                highlight_last=show_highlights and highlight_last,
                color=color_selection,
            )

        self._ax.axis("equal")
        # if view == "overpass":
        #     extent = compute_bbox(np.vstack((lat_selection, lon_selection)).T)
        # else:
        #     extent = compute_bbox(np.vstack((lat_total, lon_total)).T)

        if view == "global":
            self._ax.set_global()  # type: ignore
        elif view == "overpass":
            zoom_radius_meters = radius_km * 1e3
            if isinstance(self.projection, ccrs.PlateCarree):
                self.set_view(
                    latitude=lat_selection,
                    longitude=lon_selection,
                    pad=np.array(self.pad) + 0.25,
                )
            else:
                self._ax.set_xlim(
                    -zoom_radius_meters * (1.25 + self.pad[0]),
                    zoom_radius_meters * (1.25 + self.pad[1]),
                )
                self._ax.set_ylim(
                    -zoom_radius_meters * (1.25 + self.pad[2]),
                    zoom_radius_meters * (1.25 + self.pad[3]),
                )
        elif view == "data":
            _lats = lat_total
            is_polar_track: bool = not ismonotonic(lat_total)
            if is_polar_track:
                _lats = np.nanmin(_lats)
            if isinstance(self.projection, ccrs.PlateCarree) or not is_polar_track:
                self.set_view(latitude=_lats, longitude=lon_total)
            else:
                _dist = haversine(
                    (self.central_latitude, self.central_longitude),
                    (lat_total[0], lon_total[0]),
                    units="m",
                )

                _dist2 = haversine(
                    (self.central_latitude, self.central_longitude),
                    (lat_total[-1], lon_total[-1]),
                    units="m",
                )
                _ratio = np.max([(_dist / np.max([_dist2, 1.0])) * 0.5, 1.0])

                self._ax.set_xlim(-_dist / _ratio, _dist / _ratio)
                if lat_total[0] < lat_total[1]:
                    self._ax.set_ylim(-_dist / _ratio, _dist)
                else:
                    self._ax.set_ylim(-_dist, _dist / _ratio)

            # zoom_radius_meters = (
            #     haversine(
            #         (lat_total[0], lon_total[0]),
            #         (lat_total[-1], lon_total[-1]),
            #         units="m",
            #     )
            #     * 1.3
            # ) / 2
            # if isinstance(self.projection, ccrs.PlateCarree):
            #     self.set_view(lats=lat_total, lons=lon_total)
            # else:
            #     self._ax.set_xlim(-zoom_radius_meters, zoom_radius_meters)
            #     self._ax.set_ylim(-zoom_radius_meters, zoom_radius_meters)

            # _diameter = haversine(
            #     (lat_total[0], lon_total[0]),
            #     (lat_total[-1], lon_total[-1]),
            #     units="m",
            # )
            # _radius = _diameter / 2
            # zoom_radius_meters = _radius * 1e3 * 1.3
            # if isinstance(self.projection, ccrs.PlateCarree):
            #     self.set_view(lats=lat_total, lons=lon_total)
            # else:
            #     self._ax.set_xlim(-zoom_radius_meters, zoom_radius_meters)
            #     self._ax.set_ylim(-zoom_radius_meters, zoom_radius_meters)

        return self

    def ecplot(
        self: Self,
        ds: xr.Dataset,
        var: str | None = None,
        *,
        lat_var: str = TRACK_LAT_VAR,
        lon_var: str = TRACK_LON_VAR,
        swath_lat_var: str = SWATH_LAT_VAR,
        swath_lon_var: str = SWATH_LON_VAR,
        time_var: str = TIME_VAR,
        along_track_dim: str = ALONG_TRACK_DIM,
        across_track_dim: str = ACROSS_TRACK_DIM,
        site: SiteLike | None = None,
        radius_km: float = 100.0,
        time_range: TimeRangeLike | None = None,
        view: Literal["global", "data", "overpass"] = "global",
        zoom_tmin: TimestampLike | None = None,
        zoom_tmax: TimestampLike | None = None,
        color: ColorLike | None = "ec:earthcare",
        linewidth: float = 3,
        linestyle: str | None = "solid",
        color2: ColorLike | None = "ec:blue",
        linewidth2: float | None = None,
        linestyle2: str | None = None,
        cmap: CmapLike | None = None,
        zoom_radius_km: float | None = None,
        extent: list[float] | None = None,
        central_latitude: float | None = None,
        central_longitude: float | None = None,
        value_range: ValueRangeLike | Literal["default"] | None = "default",
        log_scale: bool | None = None,
        norm: Normalize | None = None,
        colorbar: bool = True,
        pad: float | list[float] | None = None,
        show_text_time: bool | None = None,
        show_text_frame: bool | None = None,
        show_text_overpass: bool | None = None,
        colorbar_position: str | Literal["left", "right", "top", "bottom"] = "bottom",
        colorbar_alignment: str | Literal["left", "center", "right"] = "center",
        colorbar_width: float = DEFAULT_COLORBAR_WIDTH,
        colorbar_spacing: float = 0.3,
        colorbar_length_ratio: float | str = "100%",
        colorbar_label_outside: bool = True,
        colorbar_ticks_outside: bool = True,
        colorbar_ticks_both: bool = False,
        selection_max_time_margin: (TimedeltaLike | Sequence[TimedeltaLike] | None) = None,
        show_nadir: bool = True,
        show_swath_border: bool = True,
        highlight_first: bool = False,
        highlight_last: bool = True,
    ) -> Self:
        """
        Plot the EarthCARE satellite track on a map, optionally showing a 2D swath variable if `var` is provided.

        This method collects all required data from an EarthCARE `xarray.Dataset`.
        If `var` is given, the corresponding swath variable is plotted on the map using a
        color scale. Otherwise, the satellite ground track is plotted as a colored line.
        If `time_range` or `site` is given, the selected track section within the selected time range or in proximity to ground sites are highlighted.

        Args:
            ds (xr.Dataset): The EarthCARE dataset from which data will be plotted.
            var (str | None, optional): Name of a 2D swath variable to plot. If None, only the satellite ground track is shown. Defaults to None.
            lat_var (str, optional): Name of the latitude variable for the along-track data. Defaults to TRACK_LAT_VAR.
            lon_var (str, optional): Name of the longitude variable for the along-track data. Defaults to TRACK_LON_VAR.
            swath_lat_var (str, optional): Name of the latitude variable for the swath. Defaults to SWATH_LAT_VAR.
            swath_lon_var (str, optional): Name of the longitude variable for the swath. Defaults to SWATH_LON_VAR.
            time_var (str, optional): Name of the time variable. Defaults to TIME_VAR.
            along_track_dim (str, optional): Dimension name representing the along-track direction. Defaults to ALONG_TRACK_DIM.
            across_track_dim (str, optional): Dimension name representing the across-track direction. Defaults to ACROSS_TRACK_DIM.
            site (SiteLike | None, optional): Highlights data within `radius_km` of a ground site (given either as a `Site` object or name string); ignored if not set. Defaults to None.
            radius_km (float, optional): Radius around the ground site to highlight data from; ignored if `site` not set. Defaults to 100.0.
            time_range (TimeRangeLike | None, optional): Time range to highlight as selection area; ignored if `site` is set. Defaults to None.
            view (Literal["global", "data", "overpass"], optional): Map extent mode: "global" for full world, "data" for tight bounds, or "overpass" to zoom around `site` or time range. Defaults to "global".
            zoom_tmin (TimestampLike | None, optional): Optional lower time bound used for zooming map around track. Defaults to None.
            zoom_tmax (TimestampLike | None, optional): Optional upper time bound used for zooming map around track. Defaults to None.
            color (ColorLike | None, optional): Color used for selected section of the track or entire track if no selection. Defaults to "ec:earthcare".
            linewidth (float, optional): Line width for selected track section. Defaults to 3.
            linestyle (str | None, optional): Line style for selected track section. Defaults to "solid".
            color2 (ColorLike | None, optional): Color used for unselected sections of the track. Defaults to "ec:blue".
            linewidth2 (float, optional): Line width for unselected sections. Defaults to None.
            linestyle2 (str | None, optional): Line style for unselected sections. Defaults to None.
            cmap (str | Cmap | None, optional): Colormap to use when plotting a swath variable. Defaults to None.
            zoom_radius_km (float | None, optional): If set, overrides map extent derived from `view` to use a fixed radius around the site or selection. Defaults to None.
            extent (list[float] | None, optional): Map extent in the form [lon_min, lon_max, lat_min, lat_max]. If given, overrides map extent derived from `view`. Defaults to None.
            central_latitude (float | None, optional): Central latitude used for the map projection. Defaults to None.
            central_longitude (float | None, optional): Central longitude used for the map projection. Defaults to None.
            value_range (ValueRangeLike | None, optional): Min and max range for the variable values; ignored if `var` is None. Defaults to None.
            log_scale (bool | None, optional): Whether to apply a logarithmic color scale to the variable. Defaults to None.
            norm (Normalize | None, optional): Matplotlib norm to use for color scaling. Defaults to None.
            colorbar (bool, optional): Whether to display a colorbar for the variable. Defaults to True.
            pad (float | list[float] | None, optional): Padding around the map extent; ignored if `extent` is given. Defaults to None.
            show_text_time (bool | None, optional): Whether to display the UTC time start and end of the selected track. Defaults to None.
            show_text_frame (bool | None, optional): Whether to display EarthCARE frame information. Defaults to None.
            show_text_overpass (bool | None, optional): Whether to display overpass site name and related info. Defaults to None.

        Returns:
            MapFigure: The figure object containing the map with track or swath.

        Example:
            ```python
            import earthcarekit as eck

            filepath = (
                "path/to/mydata/ECA_EXAE_ATL_NOM_1B_20250606T132535Z_20250606T150730Z_05813D.h5"
            )
            with eck.read_product(filepath) as ds:
                mf = eck.MapFigure()
                mf = mf.ecplot(ds)
            ```
        """
        if pad is not None:
            self.pad = _validate_pad(pad)
        if show_text_time is not None:
            self.show_text_time = show_text_time
        if show_text_frame is not None:
            self.show_text_frame = show_text_frame
        if show_text_overpass is not None:
            self.show_text_overpass = show_text_overpass

        _lat_var: str = lat_var
        _lon_var: str = lon_var

        _linewidth: float = linewidth
        _linewidth2: float
        if isinstance(linewidth2, (float, int)):
            _linewidth2 = float(linewidth2)
        else:
            _linewidth2 = linewidth * 0.7

        if isinstance(var, str):
            ds = ensure_updated_msi_rgb_if_required(ds, var, time_range, time_var=time_var)
            _linewidth = linewidth * 0.5
            linestyle = "dashed"
            _linewidth2 = linewidth * 0.2
            if all_in((along_track_dim, across_track_dim), [str(d) for d in ds[var].dims]):
                _lat_var = swath_lat_var
                _lon_var = swath_lon_var

        _site: Site | None = None
        if isinstance(site, Site):
            _site = site
        elif isinstance(site, str):
            _site = get_site(site)

        coords_whole_flight = get_coords(ds, lat_var=lat_var, lon_var=lon_var)

        if time_range is not None:
            if zoom_tmin is None and time_range[0] is not None:
                zoom_tmin = to_timestamp(time_range[0])
            if zoom_tmax is None and time_range[1] is not None:
                zoom_tmax = to_timestamp(time_range[1])
        if zoom_tmin or zoom_tmax:
            ds_zoomed_in = filter_time(ds, time_range=[zoom_tmin, zoom_tmax])
            coords_zoomed_in = get_coords(
                ds_zoomed_in, lat_var=_lat_var, lon_var=_lon_var, flatten=True
            )
            coords_zoomed_in_track = get_coords(ds_zoomed_in, lat_var=lat_var, lon_var=lon_var)
        else:
            coords_zoomed_in = coords_whole_flight
            coords_zoomed_in_track = get_coords(ds, lat_var=lat_var, lon_var=lon_var)

        is_polar_track: bool = False

        if isinstance(_site, Site):
            ds_overpass = filter_radius(
                ds,
                radius_km=radius_km,
                site=_site,
                lat_var=lat_var,
                lon_var=lon_var,
                along_track_dim=along_track_dim,
            )
            info_overpass = get_overpass_info(
                ds_overpass,
                radius_km=radius_km,
                site=_site,
                time_var=time_var,
                lat_var=lat_var,
                lon_var=lon_var,
                along_track_dim=along_track_dim,
            )

            _coords_whole_flight = coords_whole_flight.copy()
            _selection_max_time_margin: tuple[pd.Timedelta, pd.Timedelta] | None = None

            if selection_max_time_margin is not None:
                if isinstance(selection_max_time_margin, str):
                    _selection_max_time_margin = (
                        to_timedelta(selection_max_time_margin),
                        to_timedelta(selection_max_time_margin),
                    )
                elif isinstance(selection_max_time_margin, (Sequence, np.ndarray)):
                    _selection_max_time_margin = (
                        to_timedelta(selection_max_time_margin[0]),
                        to_timedelta(selection_max_time_margin[1]),
                    )
                else:
                    raise ValueError(
                        f"invalid selection_max_time_margin: {selection_max_time_margin}"
                    )

                _ds = filter_time(
                    ds=ds,
                    time_range=(
                        to_timestamp(ds_overpass[time_var].values[0])
                        - _selection_max_time_margin[0],
                        to_timestamp(ds_overpass[time_var].values[1])
                        + _selection_max_time_margin[1],
                    ),
                    time_var=time_var,
                )
                _coords_whole_flight = get_coords(_ds, lat_var=lat_var, lon_var=lon_var)

            coords_overpass = get_coords(ds_overpass, lat_var=lat_var, lon_var=lon_var)
            _ = self._plot_overpass(
                lat_selection=coords_overpass[:, 0],
                lon_selection=coords_overpass[:, 1],
                lat_total=_coords_whole_flight[:, 0],
                lon_total=_coords_whole_flight[:, 1],
                site=_site,
                radius_km=radius_km,
                view=view,
                timestamp=self.timestamp or info_overpass.closest_time,
                color_selection=color,
                linewidth_selection=_linewidth,
                linestyle_selection=linestyle,
                color_total=color2,
                linewidth_total=_linewidth2,
                linestyle_total=linestyle2,
                show_highlights=view == "overpass"
                or not isinstance(_selection_max_time_margin, tuple),
                radius_color=None,
            )

            if show_nadir and isinstance(_selection_max_time_margin, tuple):
                self.plot_track(
                    latitude=coords_whole_flight[:, 0],
                    longitude=coords_whole_flight[:, 1],
                    color="white",
                    linestyle="solid",
                    linewidth=2,
                    highlight_first=highlight_first,
                    highlight_last=highlight_last,
                    zorder=3,
                )

            if view == "overpass":
                if self.show_text_overpass:
                    add_text_overpass_info(self._ax, info_overpass)
            if self.show_text_time:
                add_title_earthcare_time(
                    self._ax, tmin=info_overpass.start_time, tmax=info_overpass.end_time
                )
        else:
            if isinstance(central_latitude, (int, float)):
                self.central_latitude = central_latitude
            else:
                self.central_latitude = np.nanmean(coords_zoomed_in_track[:, 0])
            if isinstance(central_longitude, (int, float)):
                self.central_longitude = central_longitude
            else:
                if not ismonotonic(coords_whole_flight[:, 0]):
                    is_polar_track = True
                    self.central_longitude = coords_whole_flight[-1, 1]
                else:
                    self.central_longitude = circular_nanmean(coords_whole_flight[:, 1])
            logger.debug(
                f"Set central coords to (lat={self.central_latitude}, lon={self.central_longitude})"
            )

            time = ds[time_var].values
            timestamp = time[len(time) // 2]
            self.timestamp = self.timestamp or to_timestamp(timestamp)
            if view == "overpass":
                if isinstance(self._inital_lod, int):
                    self.lod = self._inital_lod
                else:
                    self.lod = get_osm_lod(coords_zoomed_in[0], coords_zoomed_in[-1])
                if extent is None:
                    extent = compute_bbox(coords_zoomed_in)
                    self.extent = extent
            pos = self._ax.get_position()
            self._fig.delaxes(self._ax)
            self._ax = self._fig.add_axes(pos)  # type: ignore
            self._init_axes()
            if show_nadir:
                if time_range is not None:
                    _highlight_last = (view in ["global", "data"]) and highlight_last
                    _ = self.plot_track(
                        latitude=coords_whole_flight[:, 0],
                        longitude=coords_whole_flight[:, 1],
                        linewidth=_linewidth2,
                        linestyle=linestyle2,
                        highlight_first=False,
                        highlight_last=_highlight_last,
                        color=color2,
                    )

                    _highlight_last = (view == "overpass") and highlight_last
                    _ = self.plot_track(
                        latitude=coords_zoomed_in_track[:, 0],
                        longitude=coords_zoomed_in_track[:, 1],
                        linewidth=_linewidth,
                        linestyle=linestyle,
                        highlight_first=False,
                        highlight_last=_highlight_last,
                        color=color,
                    )
                else:
                    _ = self.plot_track(
                        latitude=coords_whole_flight[:, 0],
                        longitude=coords_whole_flight[:, 1],
                        linewidth=_linewidth,
                        linestyle=linestyle,
                        highlight_first=False,
                        highlight_last=highlight_last,
                        color=color,
                    )
            self._ax.axis("equal")
            if view == "global":
                self._ax.set_global()  # type: ignore
            elif view == "data":
                _lats = coords_whole_flight[:, 0]
                if is_polar_track:
                    _lats = np.nanmin(_lats)
                if isinstance(self.projection, ccrs.PlateCarree) or not is_polar_track:
                    self.set_view(latitude=_lats, longitude=coords_whole_flight[:, 1])
                else:
                    _dist = haversine(
                        (self.central_latitude, self.central_longitude),  # type: ignore
                        coords_whole_flight[0],
                        units="m",
                    )
                    self._ax.set_xlim(-_dist / 2, _dist / 2)
                    if coords_whole_flight[0, 0] < coords_whole_flight[1, 0]:
                        self._ax.set_ylim(-_dist / 2, _dist)
                    else:
                        self._ax.set_ylim(-_dist, _dist / 2)
            else:
                _lats = coords_zoomed_in[:, 0]
                if is_polar_track:
                    _lats = np.nanmin(_lats)
                if isinstance(self.projection, ccrs.PlateCarree) or not is_polar_track:
                    self.set_view(latitude=_lats, longitude=coords_zoomed_in[:, 1])
                else:
                    _dist = haversine(
                        (self.central_latitude, self.central_longitude),  # type: ignore
                        coords_zoomed_in[0],
                        units="m",
                    )
                    self._ax.set_xlim(-_dist / 2, _dist / 2)
                    if coords_zoomed_in[0, 0] < coords_zoomed_in[1, 0]:
                        self._ax.set_ylim(-_dist / 2, _dist)
                    else:
                        self._ax.set_ylim(-_dist, _dist / 2)
                # _lats = coords_zoomed_in[:, 0]
                # if is_polar_track:
                #     _lats = np.nanmin(_lats)
                # self.set_view(lats=_lats, lons=coords_zoomed_in[:, 1])

            if self.show_text_time:
                add_title_earthcare_time(self._ax, ds=ds, tmin=zoom_tmin, tmax=zoom_tmax)

        if isinstance(var, str):
            if cmap is None:
                cmap = get_default_cmap(var, ds)
            if isinstance(value_range, str) and value_range == "default":
                value_range = None
                if log_scale is None and norm is None:
                    norm = get_default_norm(var, file_type=ds)

            _dims_var = list(ds[var].dims)
            values = ds[var].values
            label = getattr(ds[var], "long_name", "")
            units = getattr(ds[var], "units", "")
            if across_track_dim not in _dims_var and along_track_dim in _dims_var:
                lats = ds[lat_var].values
                lons = ds[lon_var].values
                if len(values.shape) > 1:
                    values = np.nanmean(values, axis=1)
                self.plot_track(
                    lats,
                    lons,
                    z=values,
                    linewidth=linewidth,
                    cmap=cmap,
                    label=label,
                    units=units,
                    value_range=value_range,
                    log_scale=log_scale,
                    norm=norm,
                    colorbar=colorbar,
                    colorbar_position=colorbar_position,
                    colorbar_alignment=colorbar_alignment,
                    colorbar_width=colorbar_width,
                    colorbar_spacing=colorbar_spacing,
                    colorbar_length_ratio=colorbar_length_ratio,
                    colorbar_label_outside=colorbar_label_outside,
                    colorbar_ticks_outside=colorbar_ticks_outside,
                    colorbar_ticks_both=colorbar_ticks_both,
                    highlight_last=highlight_last,
                    highlight_first=highlight_first,
                )
            else:
                lats = ds[swath_lat_var].values
                lons = ds[swath_lon_var].values
                _ = self.plot_swath(
                    lats,
                    lons,
                    values,
                    cmap=cmap,
                    label=label,
                    units=units,
                    value_range=value_range,
                    log_scale=log_scale,
                    norm=norm,
                    colorbar=colorbar,
                    colorbar_position=colorbar_position,
                    colorbar_alignment=colorbar_alignment,
                    colorbar_width=colorbar_width,
                    colorbar_spacing=colorbar_spacing,
                    colorbar_length_ratio=colorbar_length_ratio,
                    colorbar_label_outside=colorbar_label_outside,
                    colorbar_ticks_outside=colorbar_ticks_outside,
                    colorbar_ticks_both=colorbar_ticks_both,
                    show_swath_border=show_swath_border,
                )

        # if view == "data":
        #     self.set_view(lats=lats, lons=lons)

        # if zoom_tmin or zoom_tmax:
        #     extent = compute_bbox(coords_zoomed_in)
        #     self._ax.set_extent(extent, crs=ccrs.PlateCarree())  # type: ignore
        if self.show_text_frame:
            add_title_earthcare_frame(self._ax, ds=ds)

        self.zoom(extent=extent, radius_km=zoom_radius_km)

        return self

    def _init_cmap(
        self: Self,
        cmap: CmapLike | None = None,
        value_range: ValueRangeLike | None = None,
        log_scale: bool | None = None,
        norm: Normalize | None = None,
    ) -> tuple[Cmap, tuple, Normalize]:
        cmap = get_cmap(cmap)

        if isinstance(value_range, Iterable):
            if len(value_range) != 2:
                raise ValueError(f"invalid `value_range`: {value_range}, expecting (vmin, vmax)")
        else:
            value_range = (None, None)

        if isinstance(cmap, Cmap) and cmap.categorical:
            norm = cmap.norm
        elif isinstance(norm, Normalize):
            if log_scale is True and not isinstance(norm, LogNorm):
                norm = LogNorm(norm.vmin, norm.vmax)
            elif log_scale is False and isinstance(norm, LogNorm):
                norm = Normalize(norm.vmin, norm.vmax)
            if value_range[0] is not None:
                norm.vmin = value_range[0]  # type: ignore # FIXME
            if value_range[1] is not None:
                norm.vmax = value_range[1]  # type: ignore # FIXME
        else:
            if log_scale is True:
                norm = LogNorm(value_range[0], value_range[1])  # type: ignore # FIXME
            else:
                norm = Normalize(value_range[0], value_range[1])  # type: ignore # FIXME

        assert isinstance(norm, Normalize)
        value_range = (norm.vmin, norm.vmax)

        return (cmap, value_range, norm)

    def plot_swath(
        self: Self,
        lats: NDArray,
        lons: NDArray,
        values: NDArray,
        label: str = "",
        units: str = "",
        cmap: CmapLike | None = None,
        value_range: ValueRangeLike | None = None,
        log_scale: bool | None = None,
        norm: Normalize | None = None,
        colorbar: bool = True,
        colorbar_position: str | Literal["left", "right", "top", "bottom"] = "bottom",
        colorbar_alignment: str | Literal["left", "center", "right"] = "center",
        colorbar_width: float = DEFAULT_COLORBAR_WIDTH,
        colorbar_spacing: float = 0.3,
        colorbar_length_ratio: float | str = "100%",
        colorbar_label_outside: bool = True,
        colorbar_ticks_outside: bool = True,
        colorbar_ticks_both: bool = False,
        show_swath_border: bool = True,
    ) -> Self:
        cmap, value_range, norm = self._init_cmap(cmap, value_range, log_scale, norm)

        if len(values.shape) == 3 and values.shape[2] == 3:
            mesh = self._ax.pcolormesh(
                lons.T,
                lats.T,
                values,
                shading="auto",
                transform=ccrs.PlateCarree(),
                rasterized=True,
            )
        else:
            mesh = self._ax.pcolormesh(
                lons,
                lats,
                values,
                cmap=cmap,
                norm=norm,
                shading="auto",
                transform=ccrs.PlateCarree(),
                rasterized=True,
            )
            if colorbar:
                cb_kwargs = dict(
                    label=format_var_label(label, units),
                    position=colorbar_position,
                    alignment=colorbar_alignment,
                    width=colorbar_width,
                    spacing=colorbar_spacing,
                    length_ratio=colorbar_length_ratio,
                    label_outside=colorbar_label_outside,
                    ticks_outside=colorbar_ticks_outside,
                    ticks_both=colorbar_ticks_both,
                )
                self.set_colorbar(
                    data=mesh,
                    cmap=cmap,
                    **cb_kwargs,  # type: ignore
                )
                self.set_colorbar_tick_scale(multiplier=self.colorbar_tick_scale)

        if show_swath_border:
            edgecolor = Color("white").set_alpha(0.5)
            _ = self.plot_track(
                lats[:, 0],
                lons[:, 0],
                highlight_first=False,
                highlight_last=False,
                color=edgecolor,
                linewidth=1,
            )
            _ = self.plot_track(
                lats[:, -1],
                lons[:, -1],
                highlight_first=False,
                highlight_last=False,
                color=edgecolor,
                linewidth=1,
            )
            _ = self.plot_track(
                lats[0, :],
                lons[0, :],
                highlight_first=False,
                highlight_last=False,
                color=edgecolor,
                linewidth=1,
            )
            _ = self.plot_track(
                lats[-1, :],
                lons[-1, :],
                highlight_first=False,
                highlight_last=False,
                color=edgecolor,
                linewidth=1,
            )

        return self

    def zoom(self: Self, extent: ArrayLike | None = None, radius_km: float | None = None) -> Self:
        radius_meters: float = 0

        if extent is not None:
            extent = np.asarray(extent)
            if extent.shape[0] != 4:
                ValueError(
                    f"'extent' has wrong size ({extent.shape[0]}), expecting size of 4 (min_lon, max_lon, min_lat, max_lat)"
                )
            lon_extent_km = haversine([extent[2], extent[0]], [extent[2], extent[1]])
            lat_extent_km = haversine([extent[2], extent[0]], [extent[3], extent[0]])
            radius_meters = np.max([lon_extent_km, lat_extent_km]) * 1e3

        if isinstance(radius_km, (int, float)):
            radius_meters = radius_km * 1e3

        if isinstance(self.projection, ccrs.PlateCarree) and extent is not None:
            self._ax.set_extent(extent, crs=ccrs.PlateCarree())  # type: ignore
        elif not isinstance(self.projection, ccrs.PlateCarree) and radius_km is not None:
            self._ax.set_xlim(-radius_meters, radius_meters)
            self._ax.set_ylim(-radius_meters, radius_meters)

        return self

    def to_texture(self: Self, remove_images: bool = True, remove_features: bool = True) -> Self:
        super().to_texture()

        # Remove outline box around map
        self._ax.spines["geo"].set_visible(False)

        # Make the map fill the whole figure
        self._ax.set_position((0.0, 0.0, 1.0, 1.0))

        if self.grid_lines:
            self.grid_lines.remove()

        if remove_images:
            remove_images_from_axis(self._ax)

        if remove_features:
            remove_features_from_axis(self._ax)

        remove_rectangles(self._fig)

        self._ax.set_facecolor("none")

        return self

ax property

ax: Axes

The main matplotlib axis of the figure.

ax_right property

ax_right: Axes | None

The right-side matplotlib y-axis, if present.

ax_top property

ax_top: Axes | None

The top-side matplotlib x-axis, if present.

colorbar property

colorbar: Colorbar | None

The matplotlib colorbar, if present.

ecplot

ecplot(
    ds: Dataset,
    var: str | None = None,
    *,
    lat_var: str = TRACK_LAT_VAR,
    lon_var: str = TRACK_LON_VAR,
    swath_lat_var: str = SWATH_LAT_VAR,
    swath_lon_var: str = SWATH_LON_VAR,
    time_var: str = TIME_VAR,
    along_track_dim: str = ALONG_TRACK_DIM,
    across_track_dim: str = ACROSS_TRACK_DIM,
    site: SiteLike | None = None,
    radius_km: float = 100.0,
    time_range: TimeRangeLike | None = None,
    view: Literal["global", "data", "overpass"] = "global",
    zoom_tmin: TimestampLike | None = None,
    zoom_tmax: TimestampLike | None = None,
    color: ColorLike | None = "ec:earthcare",
    linewidth: float = 3,
    linestyle: str | None = "solid",
    color2: ColorLike | None = "ec:blue",
    linewidth2: float | None = None,
    linestyle2: str | None = None,
    cmap: CmapLike | None = None,
    zoom_radius_km: float | None = None,
    extent: list[float] | None = None,
    central_latitude: float | None = None,
    central_longitude: float | None = None,
    value_range: ValueRangeLike | Literal["default"] | None = "default",
    log_scale: bool | None = None,
    norm: Normalize | None = None,
    colorbar: bool = True,
    pad: float | list[float] | None = None,
    show_text_time: bool | None = None,
    show_text_frame: bool | None = None,
    show_text_overpass: bool | None = None,
    colorbar_position: str | Literal["left", "right", "top", "bottom"] = "bottom",
    colorbar_alignment: str | Literal["left", "center", "right"] = "center",
    colorbar_width: float = DEFAULT_COLORBAR_WIDTH,
    colorbar_spacing: float = 0.3,
    colorbar_length_ratio: float | str = "100%",
    colorbar_label_outside: bool = True,
    colorbar_ticks_outside: bool = True,
    colorbar_ticks_both: bool = False,
    selection_max_time_margin: TimedeltaLike | Sequence[TimedeltaLike] | None = None,
    show_nadir: bool = True,
    show_swath_border: bool = True,
    highlight_first: bool = False,
    highlight_last: bool = True
) -> Self

Plot the EarthCARE satellite track on a map, optionally showing a 2D swath variable if var is provided.

This method collects all required data from an EarthCARE xarray.Dataset. If var is given, the corresponding swath variable is plotted on the map using a color scale. Otherwise, the satellite ground track is plotted as a colored line. If time_range or site is given, the selected track section within the selected time range or in proximity to ground sites are highlighted.

Parameters:

Name Type Description Default
ds Dataset

The EarthCARE dataset from which data will be plotted.

required
var str | None

Name of a 2D swath variable to plot. If None, only the satellite ground track is shown. Defaults to None.

None
lat_var str

Name of the latitude variable for the along-track data. Defaults to TRACK_LAT_VAR.

TRACK_LAT_VAR
lon_var str

Name of the longitude variable for the along-track data. Defaults to TRACK_LON_VAR.

TRACK_LON_VAR
swath_lat_var str

Name of the latitude variable for the swath. Defaults to SWATH_LAT_VAR.

SWATH_LAT_VAR
swath_lon_var str

Name of the longitude variable for the swath. Defaults to SWATH_LON_VAR.

SWATH_LON_VAR
time_var str

Name of the time variable. Defaults to TIME_VAR.

TIME_VAR
along_track_dim str

Dimension name representing the along-track direction. Defaults to ALONG_TRACK_DIM.

ALONG_TRACK_DIM
across_track_dim str

Dimension name representing the across-track direction. Defaults to ACROSS_TRACK_DIM.

ACROSS_TRACK_DIM
site SiteLike | None

Highlights data within radius_km of a ground site (given either as a Site object or name string); ignored if not set. Defaults to None.

None
radius_km float

Radius around the ground site to highlight data from; ignored if site not set. Defaults to 100.0.

100.0
time_range TimeRangeLike | None

Time range to highlight as selection area; ignored if site is set. Defaults to None.

None
view Literal['global', 'data', 'overpass']

Map extent mode: "global" for full world, "data" for tight bounds, or "overpass" to zoom around site or time range. Defaults to "global".

'global'
zoom_tmin TimestampLike | None

Optional lower time bound used for zooming map around track. Defaults to None.

None
zoom_tmax TimestampLike | None

Optional upper time bound used for zooming map around track. Defaults to None.

None
color ColorLike | None

Color used for selected section of the track or entire track if no selection. Defaults to "ec:earthcare".

'ec:earthcare'
linewidth float

Line width for selected track section. Defaults to 3.

3
linestyle str | None

Line style for selected track section. Defaults to "solid".

'solid'
color2 ColorLike | None

Color used for unselected sections of the track. Defaults to "ec:blue".

'ec:blue'
linewidth2 float

Line width for unselected sections. Defaults to None.

None
linestyle2 str | None

Line style for unselected sections. Defaults to None.

None
cmap str | Cmap | None

Colormap to use when plotting a swath variable. Defaults to None.

None
zoom_radius_km float | None

If set, overrides map extent derived from view to use a fixed radius around the site or selection. Defaults to None.

None
extent list[float] | None

Map extent in the form [lon_min, lon_max, lat_min, lat_max]. If given, overrides map extent derived from view. Defaults to None.

None
central_latitude float | None

Central latitude used for the map projection. Defaults to None.

None
central_longitude float | None

Central longitude used for the map projection. Defaults to None.

None
value_range ValueRangeLike | None

Min and max range for the variable values; ignored if var is None. Defaults to None.

'default'
log_scale bool | None

Whether to apply a logarithmic color scale to the variable. Defaults to None.

None
norm Normalize | None

Matplotlib norm to use for color scaling. Defaults to None.

None
colorbar bool

Whether to display a colorbar for the variable. Defaults to True.

True
pad float | list[float] | None

Padding around the map extent; ignored if extent is given. Defaults to None.

None
show_text_time bool | None

Whether to display the UTC time start and end of the selected track. Defaults to None.

None
show_text_frame bool | None

Whether to display EarthCARE frame information. Defaults to None.

None
show_text_overpass bool | None

Whether to display overpass site name and related info. Defaults to None.

None

Returns:

Name Type Description
MapFigure Self

The figure object containing the map with track or swath.

Example
import earthcarekit as eck

filepath = (
    "path/to/mydata/ECA_EXAE_ATL_NOM_1B_20250606T132535Z_20250606T150730Z_05813D.h5"
)
with eck.read_product(filepath) as ds:
    mf = eck.MapFigure()
    mf = mf.ecplot(ds)
Source code in earthcarekit/plot/figure/map.py
1418
1419
1420
1421
1422
1423
1424
1425
1426
1427
1428
1429
1430
1431
1432
1433
1434
1435
1436
1437
1438
1439
1440
1441
1442
1443
1444
1445
1446
1447
1448
1449
1450
1451
1452
1453
1454
1455
1456
1457
1458
1459
1460
1461
1462
1463
1464
1465
1466
1467
1468
1469
1470
1471
1472
1473
1474
1475
1476
1477
1478
1479
1480
1481
1482
1483
1484
1485
1486
1487
1488
1489
1490
1491
1492
1493
1494
1495
1496
1497
1498
1499
1500
1501
1502
1503
1504
1505
1506
1507
1508
1509
1510
1511
1512
1513
1514
1515
1516
1517
1518
1519
1520
1521
1522
1523
1524
1525
1526
1527
1528
1529
1530
1531
1532
1533
1534
1535
1536
1537
1538
1539
1540
1541
1542
1543
1544
1545
1546
1547
1548
1549
1550
1551
1552
1553
1554
1555
1556
1557
1558
1559
1560
1561
1562
1563
1564
1565
1566
1567
1568
1569
1570
1571
1572
1573
1574
1575
1576
1577
1578
1579
1580
1581
1582
1583
1584
1585
1586
1587
1588
1589
1590
1591
1592
1593
1594
1595
1596
1597
1598
1599
1600
1601
1602
1603
1604
1605
1606
1607
1608
1609
1610
1611
1612
1613
1614
1615
1616
1617
1618
1619
1620
1621
1622
1623
1624
1625
1626
1627
1628
1629
1630
1631
1632
1633
1634
1635
1636
1637
1638
1639
1640
1641
1642
1643
1644
1645
1646
1647
1648
1649
1650
1651
1652
1653
1654
1655
1656
1657
1658
1659
1660
1661
1662
1663
1664
1665
1666
1667
1668
1669
1670
1671
1672
1673
1674
1675
1676
1677
1678
1679
1680
1681
1682
1683
1684
1685
1686
1687
1688
1689
1690
1691
1692
1693
1694
1695
1696
1697
1698
1699
1700
1701
1702
1703
1704
1705
1706
1707
1708
1709
1710
1711
1712
1713
1714
1715
1716
1717
1718
1719
1720
1721
1722
1723
1724
1725
1726
1727
1728
1729
1730
1731
1732
1733
1734
1735
1736
1737
1738
1739
1740
1741
1742
1743
1744
1745
1746
1747
1748
1749
1750
1751
1752
1753
1754
1755
1756
1757
1758
1759
1760
1761
1762
1763
1764
1765
1766
1767
1768
1769
1770
1771
1772
1773
1774
1775
1776
1777
1778
1779
1780
1781
1782
1783
1784
1785
1786
1787
1788
1789
1790
1791
1792
1793
1794
1795
1796
1797
1798
1799
1800
1801
1802
1803
1804
1805
1806
1807
1808
1809
1810
1811
1812
1813
1814
1815
1816
1817
1818
1819
1820
1821
1822
1823
1824
1825
1826
1827
1828
1829
1830
1831
1832
1833
1834
1835
1836
1837
1838
1839
1840
1841
1842
1843
1844
1845
1846
1847
1848
1849
1850
1851
1852
1853
1854
1855
1856
1857
def ecplot(
    self: Self,
    ds: xr.Dataset,
    var: str | None = None,
    *,
    lat_var: str = TRACK_LAT_VAR,
    lon_var: str = TRACK_LON_VAR,
    swath_lat_var: str = SWATH_LAT_VAR,
    swath_lon_var: str = SWATH_LON_VAR,
    time_var: str = TIME_VAR,
    along_track_dim: str = ALONG_TRACK_DIM,
    across_track_dim: str = ACROSS_TRACK_DIM,
    site: SiteLike | None = None,
    radius_km: float = 100.0,
    time_range: TimeRangeLike | None = None,
    view: Literal["global", "data", "overpass"] = "global",
    zoom_tmin: TimestampLike | None = None,
    zoom_tmax: TimestampLike | None = None,
    color: ColorLike | None = "ec:earthcare",
    linewidth: float = 3,
    linestyle: str | None = "solid",
    color2: ColorLike | None = "ec:blue",
    linewidth2: float | None = None,
    linestyle2: str | None = None,
    cmap: CmapLike | None = None,
    zoom_radius_km: float | None = None,
    extent: list[float] | None = None,
    central_latitude: float | None = None,
    central_longitude: float | None = None,
    value_range: ValueRangeLike | Literal["default"] | None = "default",
    log_scale: bool | None = None,
    norm: Normalize | None = None,
    colorbar: bool = True,
    pad: float | list[float] | None = None,
    show_text_time: bool | None = None,
    show_text_frame: bool | None = None,
    show_text_overpass: bool | None = None,
    colorbar_position: str | Literal["left", "right", "top", "bottom"] = "bottom",
    colorbar_alignment: str | Literal["left", "center", "right"] = "center",
    colorbar_width: float = DEFAULT_COLORBAR_WIDTH,
    colorbar_spacing: float = 0.3,
    colorbar_length_ratio: float | str = "100%",
    colorbar_label_outside: bool = True,
    colorbar_ticks_outside: bool = True,
    colorbar_ticks_both: bool = False,
    selection_max_time_margin: (TimedeltaLike | Sequence[TimedeltaLike] | None) = None,
    show_nadir: bool = True,
    show_swath_border: bool = True,
    highlight_first: bool = False,
    highlight_last: bool = True,
) -> Self:
    """
    Plot the EarthCARE satellite track on a map, optionally showing a 2D swath variable if `var` is provided.

    This method collects all required data from an EarthCARE `xarray.Dataset`.
    If `var` is given, the corresponding swath variable is plotted on the map using a
    color scale. Otherwise, the satellite ground track is plotted as a colored line.
    If `time_range` or `site` is given, the selected track section within the selected time range or in proximity to ground sites are highlighted.

    Args:
        ds (xr.Dataset): The EarthCARE dataset from which data will be plotted.
        var (str | None, optional): Name of a 2D swath variable to plot. If None, only the satellite ground track is shown. Defaults to None.
        lat_var (str, optional): Name of the latitude variable for the along-track data. Defaults to TRACK_LAT_VAR.
        lon_var (str, optional): Name of the longitude variable for the along-track data. Defaults to TRACK_LON_VAR.
        swath_lat_var (str, optional): Name of the latitude variable for the swath. Defaults to SWATH_LAT_VAR.
        swath_lon_var (str, optional): Name of the longitude variable for the swath. Defaults to SWATH_LON_VAR.
        time_var (str, optional): Name of the time variable. Defaults to TIME_VAR.
        along_track_dim (str, optional): Dimension name representing the along-track direction. Defaults to ALONG_TRACK_DIM.
        across_track_dim (str, optional): Dimension name representing the across-track direction. Defaults to ACROSS_TRACK_DIM.
        site (SiteLike | None, optional): Highlights data within `radius_km` of a ground site (given either as a `Site` object or name string); ignored if not set. Defaults to None.
        radius_km (float, optional): Radius around the ground site to highlight data from; ignored if `site` not set. Defaults to 100.0.
        time_range (TimeRangeLike | None, optional): Time range to highlight as selection area; ignored if `site` is set. Defaults to None.
        view (Literal["global", "data", "overpass"], optional): Map extent mode: "global" for full world, "data" for tight bounds, or "overpass" to zoom around `site` or time range. Defaults to "global".
        zoom_tmin (TimestampLike | None, optional): Optional lower time bound used for zooming map around track. Defaults to None.
        zoom_tmax (TimestampLike | None, optional): Optional upper time bound used for zooming map around track. Defaults to None.
        color (ColorLike | None, optional): Color used for selected section of the track or entire track if no selection. Defaults to "ec:earthcare".
        linewidth (float, optional): Line width for selected track section. Defaults to 3.
        linestyle (str | None, optional): Line style for selected track section. Defaults to "solid".
        color2 (ColorLike | None, optional): Color used for unselected sections of the track. Defaults to "ec:blue".
        linewidth2 (float, optional): Line width for unselected sections. Defaults to None.
        linestyle2 (str | None, optional): Line style for unselected sections. Defaults to None.
        cmap (str | Cmap | None, optional): Colormap to use when plotting a swath variable. Defaults to None.
        zoom_radius_km (float | None, optional): If set, overrides map extent derived from `view` to use a fixed radius around the site or selection. Defaults to None.
        extent (list[float] | None, optional): Map extent in the form [lon_min, lon_max, lat_min, lat_max]. If given, overrides map extent derived from `view`. Defaults to None.
        central_latitude (float | None, optional): Central latitude used for the map projection. Defaults to None.
        central_longitude (float | None, optional): Central longitude used for the map projection. Defaults to None.
        value_range (ValueRangeLike | None, optional): Min and max range for the variable values; ignored if `var` is None. Defaults to None.
        log_scale (bool | None, optional): Whether to apply a logarithmic color scale to the variable. Defaults to None.
        norm (Normalize | None, optional): Matplotlib norm to use for color scaling. Defaults to None.
        colorbar (bool, optional): Whether to display a colorbar for the variable. Defaults to True.
        pad (float | list[float] | None, optional): Padding around the map extent; ignored if `extent` is given. Defaults to None.
        show_text_time (bool | None, optional): Whether to display the UTC time start and end of the selected track. Defaults to None.
        show_text_frame (bool | None, optional): Whether to display EarthCARE frame information. Defaults to None.
        show_text_overpass (bool | None, optional): Whether to display overpass site name and related info. Defaults to None.

    Returns:
        MapFigure: The figure object containing the map with track or swath.

    Example:
        ```python
        import earthcarekit as eck

        filepath = (
            "path/to/mydata/ECA_EXAE_ATL_NOM_1B_20250606T132535Z_20250606T150730Z_05813D.h5"
        )
        with eck.read_product(filepath) as ds:
            mf = eck.MapFigure()
            mf = mf.ecplot(ds)
        ```
    """
    if pad is not None:
        self.pad = _validate_pad(pad)
    if show_text_time is not None:
        self.show_text_time = show_text_time
    if show_text_frame is not None:
        self.show_text_frame = show_text_frame
    if show_text_overpass is not None:
        self.show_text_overpass = show_text_overpass

    _lat_var: str = lat_var
    _lon_var: str = lon_var

    _linewidth: float = linewidth
    _linewidth2: float
    if isinstance(linewidth2, (float, int)):
        _linewidth2 = float(linewidth2)
    else:
        _linewidth2 = linewidth * 0.7

    if isinstance(var, str):
        ds = ensure_updated_msi_rgb_if_required(ds, var, time_range, time_var=time_var)
        _linewidth = linewidth * 0.5
        linestyle = "dashed"
        _linewidth2 = linewidth * 0.2
        if all_in((along_track_dim, across_track_dim), [str(d) for d in ds[var].dims]):
            _lat_var = swath_lat_var
            _lon_var = swath_lon_var

    _site: Site | None = None
    if isinstance(site, Site):
        _site = site
    elif isinstance(site, str):
        _site = get_site(site)

    coords_whole_flight = get_coords(ds, lat_var=lat_var, lon_var=lon_var)

    if time_range is not None:
        if zoom_tmin is None and time_range[0] is not None:
            zoom_tmin = to_timestamp(time_range[0])
        if zoom_tmax is None and time_range[1] is not None:
            zoom_tmax = to_timestamp(time_range[1])
    if zoom_tmin or zoom_tmax:
        ds_zoomed_in = filter_time(ds, time_range=[zoom_tmin, zoom_tmax])
        coords_zoomed_in = get_coords(
            ds_zoomed_in, lat_var=_lat_var, lon_var=_lon_var, flatten=True
        )
        coords_zoomed_in_track = get_coords(ds_zoomed_in, lat_var=lat_var, lon_var=lon_var)
    else:
        coords_zoomed_in = coords_whole_flight
        coords_zoomed_in_track = get_coords(ds, lat_var=lat_var, lon_var=lon_var)

    is_polar_track: bool = False

    if isinstance(_site, Site):
        ds_overpass = filter_radius(
            ds,
            radius_km=radius_km,
            site=_site,
            lat_var=lat_var,
            lon_var=lon_var,
            along_track_dim=along_track_dim,
        )
        info_overpass = get_overpass_info(
            ds_overpass,
            radius_km=radius_km,
            site=_site,
            time_var=time_var,
            lat_var=lat_var,
            lon_var=lon_var,
            along_track_dim=along_track_dim,
        )

        _coords_whole_flight = coords_whole_flight.copy()
        _selection_max_time_margin: tuple[pd.Timedelta, pd.Timedelta] | None = None

        if selection_max_time_margin is not None:
            if isinstance(selection_max_time_margin, str):
                _selection_max_time_margin = (
                    to_timedelta(selection_max_time_margin),
                    to_timedelta(selection_max_time_margin),
                )
            elif isinstance(selection_max_time_margin, (Sequence, np.ndarray)):
                _selection_max_time_margin = (
                    to_timedelta(selection_max_time_margin[0]),
                    to_timedelta(selection_max_time_margin[1]),
                )
            else:
                raise ValueError(
                    f"invalid selection_max_time_margin: {selection_max_time_margin}"
                )

            _ds = filter_time(
                ds=ds,
                time_range=(
                    to_timestamp(ds_overpass[time_var].values[0])
                    - _selection_max_time_margin[0],
                    to_timestamp(ds_overpass[time_var].values[1])
                    + _selection_max_time_margin[1],
                ),
                time_var=time_var,
            )
            _coords_whole_flight = get_coords(_ds, lat_var=lat_var, lon_var=lon_var)

        coords_overpass = get_coords(ds_overpass, lat_var=lat_var, lon_var=lon_var)
        _ = self._plot_overpass(
            lat_selection=coords_overpass[:, 0],
            lon_selection=coords_overpass[:, 1],
            lat_total=_coords_whole_flight[:, 0],
            lon_total=_coords_whole_flight[:, 1],
            site=_site,
            radius_km=radius_km,
            view=view,
            timestamp=self.timestamp or info_overpass.closest_time,
            color_selection=color,
            linewidth_selection=_linewidth,
            linestyle_selection=linestyle,
            color_total=color2,
            linewidth_total=_linewidth2,
            linestyle_total=linestyle2,
            show_highlights=view == "overpass"
            or not isinstance(_selection_max_time_margin, tuple),
            radius_color=None,
        )

        if show_nadir and isinstance(_selection_max_time_margin, tuple):
            self.plot_track(
                latitude=coords_whole_flight[:, 0],
                longitude=coords_whole_flight[:, 1],
                color="white",
                linestyle="solid",
                linewidth=2,
                highlight_first=highlight_first,
                highlight_last=highlight_last,
                zorder=3,
            )

        if view == "overpass":
            if self.show_text_overpass:
                add_text_overpass_info(self._ax, info_overpass)
        if self.show_text_time:
            add_title_earthcare_time(
                self._ax, tmin=info_overpass.start_time, tmax=info_overpass.end_time
            )
    else:
        if isinstance(central_latitude, (int, float)):
            self.central_latitude = central_latitude
        else:
            self.central_latitude = np.nanmean(coords_zoomed_in_track[:, 0])
        if isinstance(central_longitude, (int, float)):
            self.central_longitude = central_longitude
        else:
            if not ismonotonic(coords_whole_flight[:, 0]):
                is_polar_track = True
                self.central_longitude = coords_whole_flight[-1, 1]
            else:
                self.central_longitude = circular_nanmean(coords_whole_flight[:, 1])
        logger.debug(
            f"Set central coords to (lat={self.central_latitude}, lon={self.central_longitude})"
        )

        time = ds[time_var].values
        timestamp = time[len(time) // 2]
        self.timestamp = self.timestamp or to_timestamp(timestamp)
        if view == "overpass":
            if isinstance(self._inital_lod, int):
                self.lod = self._inital_lod
            else:
                self.lod = get_osm_lod(coords_zoomed_in[0], coords_zoomed_in[-1])
            if extent is None:
                extent = compute_bbox(coords_zoomed_in)
                self.extent = extent
        pos = self._ax.get_position()
        self._fig.delaxes(self._ax)
        self._ax = self._fig.add_axes(pos)  # type: ignore
        self._init_axes()
        if show_nadir:
            if time_range is not None:
                _highlight_last = (view in ["global", "data"]) and highlight_last
                _ = self.plot_track(
                    latitude=coords_whole_flight[:, 0],
                    longitude=coords_whole_flight[:, 1],
                    linewidth=_linewidth2,
                    linestyle=linestyle2,
                    highlight_first=False,
                    highlight_last=_highlight_last,
                    color=color2,
                )

                _highlight_last = (view == "overpass") and highlight_last
                _ = self.plot_track(
                    latitude=coords_zoomed_in_track[:, 0],
                    longitude=coords_zoomed_in_track[:, 1],
                    linewidth=_linewidth,
                    linestyle=linestyle,
                    highlight_first=False,
                    highlight_last=_highlight_last,
                    color=color,
                )
            else:
                _ = self.plot_track(
                    latitude=coords_whole_flight[:, 0],
                    longitude=coords_whole_flight[:, 1],
                    linewidth=_linewidth,
                    linestyle=linestyle,
                    highlight_first=False,
                    highlight_last=highlight_last,
                    color=color,
                )
        self._ax.axis("equal")
        if view == "global":
            self._ax.set_global()  # type: ignore
        elif view == "data":
            _lats = coords_whole_flight[:, 0]
            if is_polar_track:
                _lats = np.nanmin(_lats)
            if isinstance(self.projection, ccrs.PlateCarree) or not is_polar_track:
                self.set_view(latitude=_lats, longitude=coords_whole_flight[:, 1])
            else:
                _dist = haversine(
                    (self.central_latitude, self.central_longitude),  # type: ignore
                    coords_whole_flight[0],
                    units="m",
                )
                self._ax.set_xlim(-_dist / 2, _dist / 2)
                if coords_whole_flight[0, 0] < coords_whole_flight[1, 0]:
                    self._ax.set_ylim(-_dist / 2, _dist)
                else:
                    self._ax.set_ylim(-_dist, _dist / 2)
        else:
            _lats = coords_zoomed_in[:, 0]
            if is_polar_track:
                _lats = np.nanmin(_lats)
            if isinstance(self.projection, ccrs.PlateCarree) or not is_polar_track:
                self.set_view(latitude=_lats, longitude=coords_zoomed_in[:, 1])
            else:
                _dist = haversine(
                    (self.central_latitude, self.central_longitude),  # type: ignore
                    coords_zoomed_in[0],
                    units="m",
                )
                self._ax.set_xlim(-_dist / 2, _dist / 2)
                if coords_zoomed_in[0, 0] < coords_zoomed_in[1, 0]:
                    self._ax.set_ylim(-_dist / 2, _dist)
                else:
                    self._ax.set_ylim(-_dist, _dist / 2)
            # _lats = coords_zoomed_in[:, 0]
            # if is_polar_track:
            #     _lats = np.nanmin(_lats)
            # self.set_view(lats=_lats, lons=coords_zoomed_in[:, 1])

        if self.show_text_time:
            add_title_earthcare_time(self._ax, ds=ds, tmin=zoom_tmin, tmax=zoom_tmax)

    if isinstance(var, str):
        if cmap is None:
            cmap = get_default_cmap(var, ds)
        if isinstance(value_range, str) and value_range == "default":
            value_range = None
            if log_scale is None and norm is None:
                norm = get_default_norm(var, file_type=ds)

        _dims_var = list(ds[var].dims)
        values = ds[var].values
        label = getattr(ds[var], "long_name", "")
        units = getattr(ds[var], "units", "")
        if across_track_dim not in _dims_var and along_track_dim in _dims_var:
            lats = ds[lat_var].values
            lons = ds[lon_var].values
            if len(values.shape) > 1:
                values = np.nanmean(values, axis=1)
            self.plot_track(
                lats,
                lons,
                z=values,
                linewidth=linewidth,
                cmap=cmap,
                label=label,
                units=units,
                value_range=value_range,
                log_scale=log_scale,
                norm=norm,
                colorbar=colorbar,
                colorbar_position=colorbar_position,
                colorbar_alignment=colorbar_alignment,
                colorbar_width=colorbar_width,
                colorbar_spacing=colorbar_spacing,
                colorbar_length_ratio=colorbar_length_ratio,
                colorbar_label_outside=colorbar_label_outside,
                colorbar_ticks_outside=colorbar_ticks_outside,
                colorbar_ticks_both=colorbar_ticks_both,
                highlight_last=highlight_last,
                highlight_first=highlight_first,
            )
        else:
            lats = ds[swath_lat_var].values
            lons = ds[swath_lon_var].values
            _ = self.plot_swath(
                lats,
                lons,
                values,
                cmap=cmap,
                label=label,
                units=units,
                value_range=value_range,
                log_scale=log_scale,
                norm=norm,
                colorbar=colorbar,
                colorbar_position=colorbar_position,
                colorbar_alignment=colorbar_alignment,
                colorbar_width=colorbar_width,
                colorbar_spacing=colorbar_spacing,
                colorbar_length_ratio=colorbar_length_ratio,
                colorbar_label_outside=colorbar_label_outside,
                colorbar_ticks_outside=colorbar_ticks_outside,
                colorbar_ticks_both=colorbar_ticks_both,
                show_swath_border=show_swath_border,
            )

    # if view == "data":
    #     self.set_view(lats=lats, lons=lons)

    # if zoom_tmin or zoom_tmax:
    #     extent = compute_bbox(coords_zoomed_in)
    #     self._ax.set_extent(extent, crs=ccrs.PlateCarree())  # type: ignore
    if self.show_text_frame:
        add_title_earthcare_frame(self._ax, ds=ds)

    self.zoom(extent=extent, radius_km=zoom_radius_km)

    return self

fig property

fig: Figure

The underlying matplotlib figure.

invert_xaxis

invert_xaxis() -> Self

Invert the x-axis.

Source code in earthcarekit/plot/figure/_figure/base.py
def invert_xaxis(self) -> Self:
    """Invert the x-axis."""
    self._ax.invert_xaxis()
    if self._ax_top:
        self._ax_top.invert_xaxis()
    return self

invert_yaxis

invert_yaxis() -> Self

Invert the y-axis.

Source code in earthcarekit/plot/figure/_figure/base.py
def invert_yaxis(self) -> Self:
    """Invert the y-axis."""
    self._ax.invert_yaxis()
    if self._ax_right:
        self._ax_right.invert_yaxis()
    return self

legend property

legend: Legend | None

The matplotlib legend, if present.

remove_colorbar

remove_colorbar() -> None

Remove the colorbar from the figure, if present.

Source code in earthcarekit/plot/figure/_figure/base.py
def remove_colorbar(self) -> None:
    """Remove the colorbar from the figure, if present."""
    if self._colorbar:
        self._colorbar.remove()
        self._colorbar = None

remove_legend

remove_legend() -> None

Remove the legend from the figure, if present.

Source code in earthcarekit/plot/figure/_figure/base.py
def remove_legend(self) -> None:
    """Remove the legend from the figure, if present."""
    if self._legend:
        self._legend.remove()
        self._legend = None

save

save(
    filename: str = "",
    filepath: str | None = None,
    ds: Dataset | None = None,
    ds_filepath: str | None = None,
    dpi: float | Literal["figure"] = "figure",
    orbit_and_frame: str | None = None,
    utc_timestamp: TimestampLike | None = None,
    use_utc_creation_timestamp: bool = False,
    site_name: str | None = None,
    hmax: int | float | None = None,
    radius: int | float | None = None,
    extra: str | None = None,
    transparent_outside: bool = False,
    verbose: bool = True,
    print_prefix: str = "",
    create_dirs: bool = False,
    transparent_background: bool = False,
    resolution: str | None = None,
    **kwargs
) -> None

Save a figure as an image or vector graphic to a file and optionally format the file name in a structured way using EarthCARE metadata.

Parameters:

Name Type Description Default
filename str

The base name of the file. Can be extended based on other metadata provided. Defaults to empty string.

''
filepath str | None

The path where the image is saved. Can be extended based on other metadata provided. Defaults to None.

None
ds Dataset | None

A EarthCARE dataset from which metadata will be taken. Defaults to None.

None
ds_filepath str | None

A path to a EarthCARE product from which metadata will be taken. Defaults to None.

None
dpi float | figure

The resolution in dots per inch. If 'figure', use the figure's dpi value. Defaults to None.

'figure'
orbit_and_frame str | None

Metadata used in the formatting of the file name. Defaults to None.

None
utc_timestamp TimestampLike | None

Metadata used in the formatting of the file name. Defaults to None.

None
use_utc_creation_timestamp bool

Whether the time of image creation should be included in the file name. Defaults to False.

False
site_name str | None

Metadata used in the formatting of the file name. Defaults to None.

None
hmax int | float | None

Metadata used in the formatting of the file name. Defaults to None.

None
radius int | float | None

Metadata used in the formatting of the file name. Defaults to None.

None
resolution str | None

Metadata used in the formatting of the file name. Defaults to None.

None
extra str | None

A custom string to be included in the file name. Defaults to None.

None
transparent_outside bool

Whether the area outside figures should be transparent. Defaults to False.

False
verbose bool

Whether the progress of image creation should be printed to the console. Defaults to True.

True
print_prefix str

A prefix string to all console messages. Defaults to "".

''
create_dirs bool

Whether images should be saved in a folder structure based on provided metadata. Defaults to False.

False
transparent_background bool

Whether the background inside and outside of figures should be transparent. Defaults to False.

False
**kwargs dict[str, Any]

Keyword arguments passed to wrapped function call of matplotlib.pyplot.savefig.

{}
Source code in earthcarekit/plot/figure/_figure/base.py
def save(
    self: Self,
    filename: str = "",
    filepath: str | None = None,
    ds: xr.Dataset | None = None,
    ds_filepath: str | None = None,
    dpi: float | Literal["figure"] = "figure",
    orbit_and_frame: str | None = None,
    utc_timestamp: TimestampLike | None = None,
    use_utc_creation_timestamp: bool = False,
    site_name: str | None = None,
    hmax: int | float | None = None,
    radius: int | float | None = None,
    extra: str | None = None,
    transparent_outside: bool = False,
    verbose: bool = True,
    print_prefix: str = "",
    create_dirs: bool = False,
    transparent_background: bool = False,
    resolution: str | None = None,
    **kwargs,
) -> None:
    """Save a figure as an image or vector graphic to a file and optionally
    format the file name in a structured way using EarthCARE metadata.

    Args:
        filename (str, optional):
            The base name of the file. Can be extended based on other metadata provided.
            Defaults to empty string.
        filepath (str | None, optional):
            The path where the image is saved. Can be extended based on other metadata
            provided. Defaults to None.
        ds (xr.Dataset | None, optional):
            A EarthCARE dataset from which metadata will be taken. Defaults to None.
        ds_filepath (str | None, optional):
            A path to a EarthCARE product from which metadata will be taken. Defaults to None.
        dpi (float | 'figure', optional):
            The resolution in dots per inch. If 'figure', use the figure's dpi value.
            Defaults to None.
        orbit_and_frame (str | None, optional):
            Metadata used in the formatting of the file name. Defaults to None.
        utc_timestamp (TimestampLike | None, optional):
            Metadata used in the formatting of the file name. Defaults to None.
        use_utc_creation_timestamp (bool, optional):
            Whether the time of image creation should be included in the file name.
            Defaults to False.
        site_name (str | None, optional):
            Metadata used in the formatting of the file name. Defaults to None.
        hmax (int | float | None, optional):
            Metadata used in the formatting of the file name. Defaults to None.
        radius (int | float | None, optional):
            Metadata used in the formatting of the file name. Defaults to None.
        resolution (str | None, optional):
            Metadata used in the formatting of the file name. Defaults to None.
        extra (str | None, optional):
            A custom string to be included in the file name. Defaults to None.
        transparent_outside (bool, optional):
            Whether the area outside figures should be transparent. Defaults to False.
        verbose (bool, optional):
            Whether the progress of image creation should be printed to the console.
            Defaults to True.
        print_prefix (str, optional):
            A prefix string to all console messages. Defaults to "".
        create_dirs (bool, optional):
            Whether images should be saved in a folder structure based on provided metadata.
            Defaults to False.
        transparent_background (bool, optional):
            Whether the background inside and outside of figures should be transparent.
            Defaults to False.
        **kwargs (dict[str, Any]):
            Keyword arguments passed to wrapped function call of `matplotlib.pyplot.savefig`.
    """
    save_plot(
        fig=self.fig,
        filename=filename,
        filepath=filepath,
        ds=ds,
        ds_filepath=ds_filepath,
        dpi=dpi,
        orbit_and_frame=orbit_and_frame,
        utc_timestamp=utc_timestamp,
        use_utc_creation_timestamp=use_utc_creation_timestamp,
        site_name=site_name,
        hmax=hmax,
        radius=radius,
        extra=extra,
        transparent_outside=transparent_outside,
        verbose=verbose,
        print_prefix=print_prefix,
        create_dirs=create_dirs,
        transparent_background=transparent_background,
        resolution=resolution,
        **kwargs,
    )

set_colorbar_tick_scale

set_colorbar_tick_scale(
    multiplier: float | None = None, fontsize: float | str | None = None
) -> Self

Configure the scale of the colorbar tick lables, if present.

Source code in earthcarekit/plot/figure/_figure/base.py
def set_colorbar_tick_scale(
    self: Self,
    multiplier: float | None = None,
    fontsize: float | str | None = None,
) -> Self:
    """Configure the scale of the colorbar tick lables, if present."""
    if not isinstance(self._colorbar, Colorbar) or (multiplier is None and fontsize is None):
        return self

    if fontsize is None:
        ticklabels = self._colorbar.ax.yaxis.get_ticklabels()
        if len(ticklabels) == 0:
            ticklabels = self._colorbar.ax.xaxis.get_ticklabels()
        if len(ticklabels) == 0:
            return self
        fontsize = ticklabels[0].get_fontsize()

    if isinstance(fontsize, str):
        fontsize = font_manager.FontProperties(size=fontsize).get_size_in_points()

    if multiplier is not None:
        fontsize *= multiplier

    self._colorbar.ax.tick_params(labelsize=fontsize)

    return self

set_grid

set_grid(
    visible: bool | None = None,
    which: Literal["major", "minor", "both"] | None = None,
    axis: Literal["both", "x", "y"] | None = None,
    color: ColorLike | None = None,
    alpha: float = 1.0,
    linestyle: LineStyleType | None = None,
    linewidth: float | None = None,
    **kwargs
) -> Self

Configure the grid lines of the main matplotlib axis.

Source code in earthcarekit/plot/figure/_figure/base.py
def set_grid(
    self: Self,
    visible: bool | None = None,
    which: Literal["major", "minor", "both"] | None = None,
    axis: Literal["both", "x", "y"] | None = None,
    color: ColorLike | None = None,
    alpha: float = 1.0,
    linestyle: LineStyleType | None = None,
    linewidth: float | None = None,
    **kwargs,
) -> Self:
    """Configure the grid lines of the main matplotlib axis."""
    update_if_not_none(
        d=self._grid_kwargs,
        updates=dict(
            visible=visible,
            which=which,
            axis=axis,
            color=Color.from_optional(color),
            alpha=alpha,
            linestyle=linestyle,
            linewidth=linewidth,
            **kwargs,
        ),
    )

    self._ax.grid(**self._grid_kwargs)

    return self

set_legend

set_legend(
    ax: Axes | None = None,
    loc: str | None = None,
    markerscale: float | None = None,
    frameon: bool | None = None,
    facecolor: ColorLike | None = None,
    edgecolor: ColorLike | None = None,
    framealpha: float | None = None,
    fancybox: bool | None = None,
    handlelength: float | None = None,
    handletextpad: float | None = None,
    borderaxespad: float | None = None,
    ncols: int | None = None,
    edgewidth: float | None = None,
    textcolor: ColorLike | None = None,
    textweight: int | str | None = None,
    textshadealpha: float | None = None,
    textshadewidth: float | None = None,
    textshadecolor: ColorLike | None = None,
    **kwargs
) -> Self

Configure the legend.

If no axis is given and a right-side axis is present (ax_right), the legend is attached to it so that it renders above all plot elements; otherwise, the main axis is used (ax).

Source code in earthcarekit/plot/figure/_figure/base.py
def set_legend(
    self: Self,
    ax: Axes | None = None,
    loc: str | None = None,
    markerscale: float | None = None,
    frameon: bool | None = None,
    facecolor: ColorLike | None = None,
    edgecolor: ColorLike | None = None,
    framealpha: float | None = None,
    fancybox: bool | None = None,
    handlelength: float | None = None,
    handletextpad: float | None = None,
    borderaxespad: float | None = None,
    ncols: int | None = None,
    edgewidth: float | None = None,
    textcolor: ColorLike | None = None,
    textweight: int | str | None = None,
    textshadealpha: float | None = None,
    textshadewidth: float | None = None,
    textshadecolor: ColorLike | None = None,
    **kwargs,
) -> Self:
    """Configure the legend.

    If no axis is given and a right-side axis is present (`ax_right`), the legend is attached
    to it so that it renders above all plot elements; otherwise, the main axis is used (`ax`).
    """
    self.remove_legend()

    update_if_not_none(
        d=self._legend_kwargs,
        updates=dict(
            loc=loc,
            markerscale=markerscale,
            frameon=frameon,
            facecolor=Color.from_optional(facecolor),
            edgecolor=Color.from_optional(edgecolor),
            framealpha=framealpha,
            fancybox=fancybox,
            handlelength=handlelength,
            handletextpad=handletextpad,
            borderaxespad=borderaxespad,
            ncols=ncols,
            **kwargs,
        ),
    )
    update_if_not_none(
        d=self._legend_style_kwargs,
        updates=dict(
            textcolor=Color.from_optional(textcolor),
            textweight=textweight,
            textshadealpha=textshadealpha,
            textshadewidth=textshadewidth,
            textshadecolor=Color.from_optional(textshadecolor),
            edgewidth=edgewidth,
        ),
    )

    _textcolor = self._legend_style_kwargs.get("textcolor", "black")
    _textweight = self._legend_style_kwargs.get("textweight", "normal")
    _textshadealpha = self._legend_style_kwargs.get("textshadealpha", 0.0)
    _textshadewidth = self._legend_style_kwargs.get("textshadewidth", 3.0)
    _textshadecolor = self._legend_style_kwargs.get("textshadecolor", "white")
    _edgewidth = self._legend_style_kwargs.get("edgewidth", 1.5)

    if len(self._legend_handles) > 0:
        _ax = ax or self._ax_right or self._ax
        self._legend = _ax.legend(
            self._legend_handles,
            self._legend_labels,
            **self._legend_kwargs,
            handler_map={tuple: HandlerTuple(ndivide=1)},
        )
        self._legend.get_frame().set_linewidth(_edgewidth)
        for text in self._legend.get_texts():
            text.set_color(_textcolor)
            text.set_fontweight(_textweight)

            if _textshadealpha > 0:
                text = add_shade_to_text(
                    text,
                    alpha=_textshadealpha,
                    linewidth=_textshadewidth,
                    color=_textshadecolor,
                )
    return self

set_view

set_view(latitude: ArrayLike, longitude: ArrayLike, pad: float | Iterable | None = None) -> Self

Fits the plot extent to the given latitude and longitude values.

Parameters:

Name Type Description Default
latitude ArrayLike

Latitude values.

required
longitude ArrayLike

Longitude values.

required
pad float | Iterable | None

Padding or margins around the given lat/lon values. The padding is applied relative to the min/max difference along the respective lat/lon extent, e.g., lats=[-5,5] and pad=0 -> lat extent=[-5,5], pad=1 -> lat extent=[-15,15], pad=2 -> lat extent=[-25,25], etc. Can be given as single number or as a 4-element list, i.e., [left/west, right/east, bottom/south, top/north]. Defaults to None.

None

Returns:

Name Type Description
Axes Self

description

Source code in earthcarekit/plot/figure/map.py
def set_view(
    self: Self,
    latitude: ArrayLike,
    longitude: ArrayLike,
    pad: float | Iterable | None = None,
) -> Self:
    """
    Fits the plot extent to the given latitude and longitude values.

    Args:
        latitude (ArrayLike): Latitude values.
        longitude (ArrayLike): Longitude values.
        pad (float | Iterable | None, optional):
            Padding or margins around the given lat/lon values.
            The padding is applied relative to the min/max difference along the respective lat/lon extent,
            e.g., `lats=[-5,5]` and `pad=0` -> lat extent=[-5,5], `pad=1` -> lat extent=[-15,15], `pad=2` -> lat extent=[-25,25], etc.
            Can be given as single number or as a 4-element list, i.e., [left/west, right/east, bottom/south, top/north].
            Defaults to None.

    Returns:
        Axes: _description_
    """
    if isinstance(pad, (float | int | Iterable)):
        self.pad = _validate_pad(pad)
    self._ax = set_view(
        self._ax,
        self.projection,
        latitude,
        longitude,
        pad_xmin=self.pad[0],
        pad_xmax=self.pad[1],
        pad_ymin=self.pad[2],
        pad_ymax=self.pad[3],
    )
    return self

show

show() -> None

Display figure in interactive frontends (e.g., IPython/jupyter notebooks).

Source code in earthcarekit/plot/figure/_figure/base.py
def show(self) -> None:
    """Display figure in interactive frontends (e.g., `IPython`/`jupyter` notebooks)."""
    import IPython
    from IPython.display import display

    if IPython.get_ipython() is not None:
        display(self.fig)
    else:
        plt.show()

show_legend

show_legend(*args, **kwargs) -> Self

Configure the legend.

Deprecated

Use set_legend() instead.

Source code in earthcarekit/plot/figure/_figure/base.py
def show_legend(self: Self, *args, **kwargs) -> Self:
    """Configure the legend.

    Deprecated:
        Use `set_legend()` instead.
    """
    import warnings

    warnings.warn(
        "'show_legend()' is deprecated; use 'set_legend()' instead.",
        DeprecationWarning,
        stacklevel=2,
    )
    return self.set_legend(*args, **kwargs)

ProfileFigure

Bases: BaseFigure

Source code in earthcarekit/plot/figure/profile.py
 95
 96
 97
 98
 99
100
101
102
103
104
105
106
107
108
109
110
111
112
113
114
115
116
117
118
119
120
121
122
123
124
125
126
127
128
129
130
131
132
133
134
135
136
137
138
139
140
141
142
143
144
145
146
147
148
149
150
151
152
153
154
155
156
157
158
159
160
161
162
163
164
165
166
167
168
169
170
171
172
173
174
175
176
177
178
179
180
181
182
183
184
185
186
187
188
189
190
191
192
193
194
195
196
197
198
199
200
201
202
203
204
205
206
207
208
209
210
211
212
213
214
215
216
217
218
219
220
221
222
223
224
225
226
227
228
229
230
231
232
233
234
235
236
237
238
239
240
241
242
243
244
245
246
247
248
249
250
251
252
253
254
255
256
257
258
259
260
261
262
263
264
265
266
267
268
269
270
271
272
273
274
275
276
277
278
279
280
281
282
283
284
285
286
287
288
289
290
291
292
293
294
295
296
297
298
299
300
301
302
303
304
305
306
307
308
309
310
311
312
313
314
315
316
317
318
319
320
321
322
323
324
325
326
327
328
329
330
331
332
333
334
335
336
337
338
339
340
341
342
343
344
345
346
347
348
349
350
351
352
353
354
355
356
357
358
359
360
361
362
363
364
365
366
367
368
369
370
371
372
373
374
375
376
377
378
379
380
381
382
383
384
385
386
387
388
389
390
391
392
393
394
395
396
397
398
399
400
401
402
403
404
405
406
407
408
409
410
411
412
413
414
415
416
417
418
419
420
421
422
423
424
425
426
427
428
429
430
431
432
433
434
435
436
437
438
439
440
441
442
443
444
445
446
447
448
449
450
451
452
453
454
455
456
457
458
459
460
461
462
463
464
465
466
467
468
469
470
471
472
473
474
475
476
477
478
479
480
481
482
483
484
485
486
487
488
489
490
491
492
493
494
495
496
497
498
499
500
501
502
503
504
505
506
507
508
509
510
511
512
513
514
515
516
517
518
519
520
521
522
523
524
525
526
527
528
529
530
531
532
533
534
535
536
537
538
539
540
541
542
543
544
545
546
547
548
549
550
551
552
553
554
555
556
557
558
559
560
561
562
563
564
565
566
567
568
569
570
571
572
573
574
575
576
577
578
579
580
581
582
583
584
585
586
587
588
589
590
591
592
593
594
595
596
597
598
599
600
601
602
603
604
605
606
607
608
609
610
611
612
613
614
615
616
617
618
619
620
621
622
623
624
625
626
627
628
629
630
631
632
633
634
635
636
637
638
639
640
class ProfileFigure(BaseFigure):
    def __init__(
        self: Self,
        ax: Axes | None = None,
        fig: Figure | None = None,
        figsize: tuple[float, float] = (3, 4),
        dpi: int | None = None,
        title: str | None = None,
        fig_height_scale: float = 1.0,
        fig_width_scale: float = 1.0,
        axes_rect: tuple[float, float, float, float] | None = (0.0, 0.0, 1.0, 1.0),
        show_grid: bool | None = True,
        grid_kwargs: dict[str, Any] = {},
        title_kwargs: dict[str, Any] = {},
        # base
        height_axis: Literal["x", "y"] = "y",
        flip_height_axis: bool = False,
        show_legend: bool = False,
        show_height_ticks: bool = True,
        show_height_label: bool = True,
        height_range: DistanceRangeLike | None = None,
        value_range: ValueRangeLike | None = (0, None),
        label: str = "",
        units: str = "",
        **kwargs,
    ):
        # Handle deprecated kwargs
        def _handle_depr_grid_arg(old_name: str) -> None:
            if old_name in kwargs:
                msg = f"'{old_name}' is deprecated and will be removed in future versions; use 'grid_kwargs' instead."
                warnings.warn(msg, FutureWarning, stacklevel=2)
                grid_kwargs[old_name.replace("grid_", "")] = kwargs[old_name]
                del kwargs[old_name]

        _handle_depr_grid_arg("grid_which")
        _handle_depr_grid_arg("grid_axis")
        _handle_depr_grid_arg("grid_color")
        _handle_depr_grid_arg("grid_alpha")
        _handle_depr_grid_arg("grid_linestyle")
        _handle_depr_grid_arg("grid_linewidth")

        if len(kwargs) != 0:
            raise TypeError(
                f"ProfileFigure.__init__() got an unexpected keyword arguments: {[k for k in kwargs.keys()]}"
            )

        super().__init__(
            ax=ax,
            fig=fig,
            figsize=figsize,
            dpi=dpi,
            title=title,
            fig_height_scale=fig_height_scale,
            fig_width_scale=fig_width_scale,
            axes_rect=axes_rect,
            show_grid=show_grid,
            grid_kwargs=grid_kwargs,
            title_kwargs=title_kwargs,
        )

        self.selection_time_range: tuple[pd.Timestamp, pd.Timestamp] | None = None
        self.info_text: AnchoredText | None = None

        self.ax_fill_between = (
            self._ax.fill_betweenx if height_axis == "y" else self._ax.fill_between
        )
        self.ax_set_hlim = self._ax.set_ylim if height_axis == "y" else self._ax.set_xlim
        self.ax_set_vlim = self._ax.set_ylim if height_axis == "x" else self._ax.set_xlim

        self.hmin: Number | None = 0
        self.hmax: Number | None = 40e3
        if isinstance(height_range, (Sequence, np.ndarray)):
            self.hmin = height_range[0]
            self.hmax = height_range[1]

        self.vmin: Number | None = None
        self.vmax: Number | None = None
        if isinstance(value_range, (Sequence, np.ndarray)):
            self.vmin = value_range[0]
            self.vmax = value_range[1]

        self.height_axis: Literal["x", "y"] = height_axis
        self.flip_height_axis = flip_height_axis
        self.value_axis: Literal["x", "y"] = "x" if height_axis == "y" else "y"

        self.label: str | None = label
        self.units: str | None = units

        self._show_legend: bool = show_legend

        self.show_height_ticks: bool = show_height_ticks
        self.show_height_label: bool = show_height_label

        self._init_axes()

    def _init_axes(self) -> None:
        self.set_grid()

        _hmin: float | None = None if self.hmin is None else float(self.hmin)
        _hmax: float | None = None if self.hmax is None else float(self.hmax)
        _vmin: float | None = None if self.vmin is None else float(self.vmin)
        _vmax: float | None = None if self.vmax is None else float(self.vmax)
        self.ax_set_hlim(_hmin, _hmax)
        if _vmin is not None or _vmax is not None:
            if _vmin is not None and np.isnan(_vmin):
                _vmin = None
            if _vmax is not None and np.isnan(_vmax):
                _vmax = None
            self.ax_set_vlim(_vmin, _vmax)

        not isinstance(self._ax_right, Axes)

        if isinstance(self._ax_right, Axes):
            self._ax_right.remove()
        self._ax_right = self._ax.twinx()
        self._ax_right.set_ylim(self._ax.get_ylim())
        self._ax_right.set_yticklabels([])

        if isinstance(self._ax_top, Axes):
            self._ax_top.remove()
        self._ax_top = self._ax.twiny()
        self._ax_top.set_xlim(self._ax.get_xlim())
        format_numeric_ticks(
            self._ax_top,
            axis=self.value_axis,
            label=format_var_label(self.label, self.units),
            show_label=False,
        )
        self._ax_top.set_xticklabels([])

        if self.flip_height_axis:
            format_distance_ticks(
                self._ax_right,
                axis=self.height_axis,
                show_tick_labels=self.show_height_ticks,
                label="Height" if self.show_height_label else None,
            )
            self._ax.set_yticklabels([])
        else:
            format_distance_ticks(
                self._ax,
                axis=self.height_axis,
                show_tick_labels=self.show_height_ticks,
                label="Height" if self.show_height_label else None,
            )
        format_numeric_ticks(
            self._ax,
            axis=self.value_axis,
            label=format_var_label(self.label, self.units),
        )

        if self._show_legend and len(self._legend_handles) > 0:
            self._legend = self._ax.legend(
                handles=self._legend_handles,
                labels=self._legend_labels,
                fontsize="small",
                #   bbox_to_anchor=(1, 1),
                #   loc=2,
                bbox_to_anchor=(0, 1.015),
                loc="lower left",
                borderaxespad=0.25,
                edgecolor="white",
            )
        elif isinstance(self._legend, Legend):
            self._legend.remove()

    def plot(
        self: Self,
        profiles: Profile | None = None,
        *,
        values: NDArray | None = None,
        time: NDArray | None = None,
        height: NDArray | None = None,
        latitude: NDArray | None = None,
        longitude: NDArray | None = None,
        error: NDArray | None = None,
        # Common args for wrappers
        label: str | None = None,
        units: str | None = None,
        value_range: ValueRangeLike | None = (0, None),
        height_range: DistanceRangeLike | None = None,
        time_range: TimeRangeLike | None = None,
        selection_height_range: DistanceRangeLike | None = None,
        show_mean: bool = True,
        show_std: bool = True,
        show_min: bool = False,
        show_max: bool = False,
        show_sem: bool = False,
        show_error: bool = False,
        color: str | ColorLike | None = None,
        alpha: float = 1.0,
        linestyle: str = "solid",
        linewidth: Number = 1.5,
        ribbon_alpha: float = 0.2,
        show_grid: bool | None = None,
        zorder: Number | None = 1,
        legend_label: str | None = None,
        show_legend: bool | None = None,
        show_steps: bool = DEFAULT_PROFILE_SHOW_STEPS,
    ) -> Self:
        """TODO: documentation

        Args:
            profiles (Profile | None, optional): _description_. Defaults to None.
            values (NDArray | None, optional): _description_. Defaults to None.
            time (NDArray | None, optional): _description_. Defaults to None.
            height (NDArray | None, optional): _description_. Defaults to None.
            latitude (NDArray | None, optional): _description_. Defaults to None.
            longitude (NDArray | None, optional): _description_. Defaults to None.
            error (NDArray | None, optional): _description_. Defaults to None.
            label (str | None, optional): _description_. Defaults to None.
            units (str | None, optional): _description_. Defaults to None.
            value_range (ValueRangeLike | None, optional): _description_. Defaults to (0, None).
            height_range (DistanceRangeLike | None, optional): _description_. Defaults to None.
            time_range (TimeRangeLike | None, optional): _description_. Defaults to None.
            selection_height_range (DistanceRangeLike | None, optional): _description_. Defaults to None.
            show_mean (bool, optional): _description_. Defaults to True.
            show_std (bool, optional): _description_. Defaults to True.
            show_min (bool, optional): _description_. Defaults to False.
            show_max (bool, optional): _description_. Defaults to False.
            show_sem (bool, optional): _description_. Defaults to False.
            show_error (bool, optional): _description_. Defaults to False.
            color (str | ColorLike | None, optional): _description_. Defaults to None.
            alpha (float, optional): _description_. Defaults to 1.0.
            linestyle (str, optional): _description_. Defaults to "solid".
            linewidth (Number, optional): _description_. Defaults to 1.5.
            ribbon_alpha (float, optional): _description_. Defaults to 0.2.
            show_grid (bool | None, optional): _description_. Defaults to None.
            zorder (Number | None, optional): _description_. Defaults to 1.
            legend_label (str | None, optional): _description_. Defaults to None.
            show_legend (bool | None, optional): _description_. Defaults to None.
            show_steps (bool, optional): _description_. Defaults to DEFAULT_PROFILE_SHOW_STEPS.

        Raises:
            ValueError: _description_
            ValueError: _description_

        Returns:
            ProfileFigure: _description_
        """
        color = Color.from_optional(color)

        if isinstance(show_legend, bool):
            self._show_legend = show_legend

        if isinstance(show_grid, bool):
            self.set_grid(visible=show_grid)

        if isinstance(value_range, Iterable):
            if len(value_range) != 2:
                raise ValueError(f"invalid `value_range`: {value_range}, expecting (vmin, vmax)")
            else:
                if value_range[0] is not None:
                    self.vmin = value_range[0]
                if value_range[1] is not None:
                    self.vmax = value_range[1]
        else:
            value_range = (None, None)
        logger.debug(f"{value_range=}")

        if isinstance(profiles, Profile):
            values = profiles.values
            time = profiles.time
            height = profiles.height
            latitude = profiles.latitude
            longitude = profiles.longitude
            if not isinstance(label, str):
                label = profiles.label
            if not isinstance(units, str):
                units = profiles.units
            error = profiles.error
        elif values is None or height is None:
            raise ValueError(
                "Missing required arguments. Provide either a `VerticalProfiles` or all of `values` and `height`"
            )

        values = np.asarray(np.atleast_2d(values))
        if time is None:
            time = np.array([pd.Timestamp.now()] * values.shape[0])
        time = np.asarray(np.atleast_1d(time))
        height = np.asarray(height)
        is_single_profile_and_multiple_height_profiles = values.shape[0] == 1 and (
            len(height.shape) > 1 and height.shape[0] > 1
        )
        if is_single_profile_and_multiple_height_profiles:
            values = np.repeat(values, height.shape[0], axis=0)
        if latitude is not None:
            latitude = np.asarray(latitude)
        if longitude is not None:
            longitude = np.asarray(longitude)

        vp = Profile(
            values=values,
            time=time,
            height=height,
            latitude=latitude,
            longitude=longitude,
            label=label,
            units=units,
            error=error,
        )
        if is_single_profile_and_multiple_height_profiles:
            vp = vp.mean()

        vp.select_time_range(time_range)

        if isinstance(vp.label, str):
            self.label = vp.label
        if isinstance(vp.units, str):
            self.units = vp.units

        if height_range is not None:
            if isinstance(height_range, Iterable) and len(height_range) == 2:
                for i in [0, -1]:
                    height_range = list(height_range)
                    if height_range[i] is None:
                        height_range[i] = np.atleast_2d(vp.height)[0, i]
                    elif i == 0:
                        self.hmin = height_range[0]
                    elif i == -1:
                        self.hmax = height_range[-1]
                    height_range = tuple(height_range)
        else:
            height_range = (
                np.atleast_2d(vp.height)[0, 0],
                np.atleast_2d(vp.height)[0, -1],
            )

        if len(vp.height.shape) == 2 and vp.height.shape[0] == 1:
            h = vp.height[0]
        elif len(vp.height.shape) == 2:
            h = nan_mean(vp.height, axis=0)
        else:
            h = vp.height

        handle_mean: list[Line2D] | list[None] = [None]
        handle_min: list[Line2D] | list[None] = [None]
        handle_max: list[Line2D] | list[None] = [None]
        handle_std: PolyCollection | None = None
        handle_sem: PolyCollection | None = None

        if show_mean:
            if vp.values.shape[0] == 1:
                vmean = vp.values[0]
                show_std = False
                show_sem = False
                show_min = False
                show_max = False
            else:
                vmean = nan_mean(vp.values, axis=0)
            vnew, hnew = vmean, h
            if show_steps:
                vnew, hnew = _convert_vertical_profile_to_step_function(vmean, h)
            xy = (vnew, hnew) if self.height_axis == "y" else (hnew, vnew)
            handle_mean = self._ax.plot(
                *xy,
                color=color,
                alpha=alpha,
                zorder=zorder,
                linestyle=linestyle,
                linewidth=linewidth,
            )
            color = handle_mean[0].get_color()  # type: ignore

            value_range = select_value_range(vmean, value_range, pad_frac=0.01)
            if not (self.vmin is not None and self.vmin < value_range[0]):
                self.vmin = value_range[0]
            if not (self.vmax is not None and self.vmax > value_range[1]):
                self.vmax = value_range[1]

            if show_error and vp.error is not None:
                verror = vp.error.flatten()
                if show_steps:
                    verror, _ = _convert_vertical_profile_to_step_function(verror, h)
                handle_std = self.ax_fill_between(
                    hnew,
                    vnew - verror,
                    vnew + verror,
                    alpha=ribbon_alpha,
                    color=color,
                    linewidth=0,
                )

        if show_sem:
            vsem = nan_sem(vp.values, axis=0)
            if show_steps:
                vsem, _ = _convert_vertical_profile_to_step_function(vsem, h)
            handle_sem = self.ax_fill_between(
                hnew,
                vnew - vsem,
                vnew + vsem,
                alpha=ribbon_alpha,
                color=color,
                linewidth=0,
            )
        elif show_std:
            vstd = nan_std(vp.values, axis=0)
            if show_steps:
                vstd, _ = _convert_vertical_profile_to_step_function(vstd, h)
            handle_std = self.ax_fill_between(
                hnew,
                vnew - vstd,
                vnew + vstd,
                alpha=ribbon_alpha,
                color=color,
                linewidth=0,
            )

        if show_min:
            vmin = nan_min(vp.values, axis=0)
            vnew, hnew = vmin, h
            if show_steps:
                vnew, hnew = _convert_vertical_profile_to_step_function(vmin, h)
            xy = (vnew, hnew) if self.height_axis == "y" else (hnew, vnew)
            handle_min = self._ax.plot(
                *xy,
                color=color,
                alpha=alpha,
                zorder=zorder,
                linestyle="dashed",
                linewidth=linewidth,
            )
            color = handle_min[0].get_color()  # type: ignore

        if show_max:
            vmax = nan_max(vp.values, axis=0)
            vnew, hnew = vmax, h
            if show_steps:
                vnew, hnew = _convert_vertical_profile_to_step_function(vmax, h)
            xy = (vnew, hnew) if self.height_axis == "y" else (hnew, vnew)
            handle_max = self._ax.plot(
                *xy,
                color=color,
                alpha=alpha,
                zorder=zorder,
                linestyle="dashed",
                linewidth=linewidth,
            )
            color = handle_max[0].get_color()  # type: ignore

        # Legend labels
        if isinstance(legend_label, str):
            handle_std

            _handle: tuple | list = [
                *handle_mean,
                handle_std,
                handle_sem,
                *handle_min,
                *handle_max,
            ]
            _default_h = next(_h for _h in _handle if _h is not None)
            _handle = tuple([_h if _h is not None else _default_h for _h in _handle])
            self._legend_handles.append(_handle)
            self._legend_labels.append(legend_label)

        if selection_height_range:
            _shr: tuple[float, float] = validate_numeric_range(selection_height_range)
            _highlight_height_range(
                ax=self._ax,
                height_range=_shr,
            )

        self._init_axes()

        # format_height_ticks(self._ax, axis=self.height_axis)
        # format_numeric_ticks(self._ax, axis=self.value_axis, label=self.label)

        return self

    def ecplot(
        self: Self,
        ds: xr.Dataset,
        var: str,
        *,
        time_var: str = TIME_VAR,
        height_var: str = HEIGHT_VAR,
        lat_var: str = TRACK_LAT_VAR,
        lon_var: str = TRACK_LON_VAR,
        error_var: str | None = None,
        along_track_dim: str = ALONG_TRACK_DIM,
        values: NDArray | None = None,
        time: NDArray | None = None,
        height: NDArray | None = None,
        latitude: NDArray | None = None,
        longitude: NDArray | None = None,
        error: NDArray | None = None,
        site: SiteLike | None = None,
        radius_km: float = 100.0,
        # Common args for wrappers
        value_range: ValueRangeLike | None = None,
        height_range: DistanceRangeLike | None = (0, 40e3),
        time_range: TimeRangeLike | None = None,
        selection_height_range: DistanceRangeLike | None = None,
        label: str | None = None,
        units: str | None = None,
        zorder: Number | None = 1,
        legend_label: str | None = "EarthCARE",
        show_legend: bool | None = None,
        show_steps: bool = DEFAULT_PROFILE_SHOW_STEPS,
        show_error: bool = False,
        **kwargs,
    ) -> Self:
        # Collect all common args for wrapped plot function call
        local_args = locals()
        # Delete all args specific to this wrapper function
        del local_args["self"]
        del local_args["ds"]
        del local_args["var"]
        del local_args["time_var"]
        del local_args["height_var"]
        del local_args["lat_var"]
        del local_args["lon_var"]
        del local_args["error_var"]
        del local_args["along_track_dim"]
        del local_args["site"]
        del local_args["radius_km"]
        # Delete kwargs to then merge it with the residual common args
        del local_args["kwargs"]
        all_args = {**local_args, **kwargs}

        if all_args["values"] is None:
            all_args["values"] = ds[var].values
        if all_args["time"] is None:
            all_args["time"] = ds[time_var].values
        if all_args["height"] is None:
            all_args["height"] = ds[height_var].values
        if all_args["latitude"] is None:
            all_args["latitude"] = ds[lat_var].values
        if all_args["longitude"] is None:
            all_args["longitude"] = ds[lon_var].values
        if all_args["error"] is None and isinstance(error_var, str):
            all_args["error"] = ds[error_var].values
            all_args["show_error"] = True

        # Set default values depending on variable name
        if label is None:
            all_args["label"] = "Values" if not hasattr(ds[var], "long_name") else ds[var].long_name
        if units is None:
            all_args["units"] = "-" if not hasattr(ds[var], "units") else ds[var].units
        if value_range is None:
            all_args["value_range"] = get_default_profile_range(var)

        self.plot(**all_args)

        return self

ax property

ax: Axes

The main matplotlib axis of the figure.

ax_right property

ax_right: Axes | None

The right-side matplotlib y-axis, if present.

ax_top property

ax_top: Axes | None

The top-side matplotlib x-axis, if present.

colorbar property

colorbar: Colorbar | None

The matplotlib colorbar, if present.

fig property

fig: Figure

The underlying matplotlib figure.

invert_xaxis

invert_xaxis() -> Self

Invert the x-axis.

Source code in earthcarekit/plot/figure/_figure/base.py
def invert_xaxis(self) -> Self:
    """Invert the x-axis."""
    self._ax.invert_xaxis()
    if self._ax_top:
        self._ax_top.invert_xaxis()
    return self

invert_yaxis

invert_yaxis() -> Self

Invert the y-axis.

Source code in earthcarekit/plot/figure/_figure/base.py
def invert_yaxis(self) -> Self:
    """Invert the y-axis."""
    self._ax.invert_yaxis()
    if self._ax_right:
        self._ax_right.invert_yaxis()
    return self

legend property

legend: Legend | None

The matplotlib legend, if present.

plot

plot(
    profiles: Profile | None = None,
    *,
    values: NDArray | None = None,
    time: NDArray | None = None,
    height: NDArray | None = None,
    latitude: NDArray | None = None,
    longitude: NDArray | None = None,
    error: NDArray | None = None,
    label: str | None = None,
    units: str | None = None,
    value_range: ValueRangeLike | None = (0, None),
    height_range: DistanceRangeLike | None = None,
    time_range: TimeRangeLike | None = None,
    selection_height_range: DistanceRangeLike | None = None,
    show_mean: bool = True,
    show_std: bool = True,
    show_min: bool = False,
    show_max: bool = False,
    show_sem: bool = False,
    show_error: bool = False,
    color: str | ColorLike | None = None,
    alpha: float = 1.0,
    linestyle: str = "solid",
    linewidth: Number = 1.5,
    ribbon_alpha: float = 0.2,
    show_grid: bool | None = None,
    zorder: Number | None = 1,
    legend_label: str | None = None,
    show_legend: bool | None = None,
    show_steps: bool = DEFAULT_PROFILE_SHOW_STEPS
) -> Self

TODO: documentation

Parameters:

Name Type Description Default
profiles Profile | None

description. Defaults to None.

None
values NDArray | None

description. Defaults to None.

None
time NDArray | None

description. Defaults to None.

None
height NDArray | None

description. Defaults to None.

None
latitude NDArray | None

description. Defaults to None.

None
longitude NDArray | None

description. Defaults to None.

None
error NDArray | None

description. Defaults to None.

None
label str | None

description. Defaults to None.

None
units str | None

description. Defaults to None.

None
value_range ValueRangeLike | None

description. Defaults to (0, None).

(0, None)
height_range DistanceRangeLike | None

description. Defaults to None.

None
time_range TimeRangeLike | None

description. Defaults to None.

None
selection_height_range DistanceRangeLike | None

description. Defaults to None.

None
show_mean bool

description. Defaults to True.

True
show_std bool

description. Defaults to True.

True
show_min bool

description. Defaults to False.

False
show_max bool

description. Defaults to False.

False
show_sem bool

description. Defaults to False.

False
show_error bool

description. Defaults to False.

False
color str | ColorLike | None

description. Defaults to None.

None
alpha float

description. Defaults to 1.0.

1.0
linestyle str

description. Defaults to "solid".

'solid'
linewidth Number

description. Defaults to 1.5.

1.5
ribbon_alpha float

description. Defaults to 0.2.

0.2
show_grid bool | None

description. Defaults to None.

None
zorder Number | None

description. Defaults to 1.

1
legend_label str | None

description. Defaults to None.

None
show_legend bool | None

description. Defaults to None.

None
show_steps bool

description. Defaults to DEFAULT_PROFILE_SHOW_STEPS.

DEFAULT_PROFILE_SHOW_STEPS

Raises:

Type Description
ValueError

description

ValueError

description

Returns:

Name Type Description
ProfileFigure Self

description

Source code in earthcarekit/plot/figure/profile.py
def plot(
    self: Self,
    profiles: Profile | None = None,
    *,
    values: NDArray | None = None,
    time: NDArray | None = None,
    height: NDArray | None = None,
    latitude: NDArray | None = None,
    longitude: NDArray | None = None,
    error: NDArray | None = None,
    # Common args for wrappers
    label: str | None = None,
    units: str | None = None,
    value_range: ValueRangeLike | None = (0, None),
    height_range: DistanceRangeLike | None = None,
    time_range: TimeRangeLike | None = None,
    selection_height_range: DistanceRangeLike | None = None,
    show_mean: bool = True,
    show_std: bool = True,
    show_min: bool = False,
    show_max: bool = False,
    show_sem: bool = False,
    show_error: bool = False,
    color: str | ColorLike | None = None,
    alpha: float = 1.0,
    linestyle: str = "solid",
    linewidth: Number = 1.5,
    ribbon_alpha: float = 0.2,
    show_grid: bool | None = None,
    zorder: Number | None = 1,
    legend_label: str | None = None,
    show_legend: bool | None = None,
    show_steps: bool = DEFAULT_PROFILE_SHOW_STEPS,
) -> Self:
    """TODO: documentation

    Args:
        profiles (Profile | None, optional): _description_. Defaults to None.
        values (NDArray | None, optional): _description_. Defaults to None.
        time (NDArray | None, optional): _description_. Defaults to None.
        height (NDArray | None, optional): _description_. Defaults to None.
        latitude (NDArray | None, optional): _description_. Defaults to None.
        longitude (NDArray | None, optional): _description_. Defaults to None.
        error (NDArray | None, optional): _description_. Defaults to None.
        label (str | None, optional): _description_. Defaults to None.
        units (str | None, optional): _description_. Defaults to None.
        value_range (ValueRangeLike | None, optional): _description_. Defaults to (0, None).
        height_range (DistanceRangeLike | None, optional): _description_. Defaults to None.
        time_range (TimeRangeLike | None, optional): _description_. Defaults to None.
        selection_height_range (DistanceRangeLike | None, optional): _description_. Defaults to None.
        show_mean (bool, optional): _description_. Defaults to True.
        show_std (bool, optional): _description_. Defaults to True.
        show_min (bool, optional): _description_. Defaults to False.
        show_max (bool, optional): _description_. Defaults to False.
        show_sem (bool, optional): _description_. Defaults to False.
        show_error (bool, optional): _description_. Defaults to False.
        color (str | ColorLike | None, optional): _description_. Defaults to None.
        alpha (float, optional): _description_. Defaults to 1.0.
        linestyle (str, optional): _description_. Defaults to "solid".
        linewidth (Number, optional): _description_. Defaults to 1.5.
        ribbon_alpha (float, optional): _description_. Defaults to 0.2.
        show_grid (bool | None, optional): _description_. Defaults to None.
        zorder (Number | None, optional): _description_. Defaults to 1.
        legend_label (str | None, optional): _description_. Defaults to None.
        show_legend (bool | None, optional): _description_. Defaults to None.
        show_steps (bool, optional): _description_. Defaults to DEFAULT_PROFILE_SHOW_STEPS.

    Raises:
        ValueError: _description_
        ValueError: _description_

    Returns:
        ProfileFigure: _description_
    """
    color = Color.from_optional(color)

    if isinstance(show_legend, bool):
        self._show_legend = show_legend

    if isinstance(show_grid, bool):
        self.set_grid(visible=show_grid)

    if isinstance(value_range, Iterable):
        if len(value_range) != 2:
            raise ValueError(f"invalid `value_range`: {value_range}, expecting (vmin, vmax)")
        else:
            if value_range[0] is not None:
                self.vmin = value_range[0]
            if value_range[1] is not None:
                self.vmax = value_range[1]
    else:
        value_range = (None, None)
    logger.debug(f"{value_range=}")

    if isinstance(profiles, Profile):
        values = profiles.values
        time = profiles.time
        height = profiles.height
        latitude = profiles.latitude
        longitude = profiles.longitude
        if not isinstance(label, str):
            label = profiles.label
        if not isinstance(units, str):
            units = profiles.units
        error = profiles.error
    elif values is None or height is None:
        raise ValueError(
            "Missing required arguments. Provide either a `VerticalProfiles` or all of `values` and `height`"
        )

    values = np.asarray(np.atleast_2d(values))
    if time is None:
        time = np.array([pd.Timestamp.now()] * values.shape[0])
    time = np.asarray(np.atleast_1d(time))
    height = np.asarray(height)
    is_single_profile_and_multiple_height_profiles = values.shape[0] == 1 and (
        len(height.shape) > 1 and height.shape[0] > 1
    )
    if is_single_profile_and_multiple_height_profiles:
        values = np.repeat(values, height.shape[0], axis=0)
    if latitude is not None:
        latitude = np.asarray(latitude)
    if longitude is not None:
        longitude = np.asarray(longitude)

    vp = Profile(
        values=values,
        time=time,
        height=height,
        latitude=latitude,
        longitude=longitude,
        label=label,
        units=units,
        error=error,
    )
    if is_single_profile_and_multiple_height_profiles:
        vp = vp.mean()

    vp.select_time_range(time_range)

    if isinstance(vp.label, str):
        self.label = vp.label
    if isinstance(vp.units, str):
        self.units = vp.units

    if height_range is not None:
        if isinstance(height_range, Iterable) and len(height_range) == 2:
            for i in [0, -1]:
                height_range = list(height_range)
                if height_range[i] is None:
                    height_range[i] = np.atleast_2d(vp.height)[0, i]
                elif i == 0:
                    self.hmin = height_range[0]
                elif i == -1:
                    self.hmax = height_range[-1]
                height_range = tuple(height_range)
    else:
        height_range = (
            np.atleast_2d(vp.height)[0, 0],
            np.atleast_2d(vp.height)[0, -1],
        )

    if len(vp.height.shape) == 2 and vp.height.shape[0] == 1:
        h = vp.height[0]
    elif len(vp.height.shape) == 2:
        h = nan_mean(vp.height, axis=0)
    else:
        h = vp.height

    handle_mean: list[Line2D] | list[None] = [None]
    handle_min: list[Line2D] | list[None] = [None]
    handle_max: list[Line2D] | list[None] = [None]
    handle_std: PolyCollection | None = None
    handle_sem: PolyCollection | None = None

    if show_mean:
        if vp.values.shape[0] == 1:
            vmean = vp.values[0]
            show_std = False
            show_sem = False
            show_min = False
            show_max = False
        else:
            vmean = nan_mean(vp.values, axis=0)
        vnew, hnew = vmean, h
        if show_steps:
            vnew, hnew = _convert_vertical_profile_to_step_function(vmean, h)
        xy = (vnew, hnew) if self.height_axis == "y" else (hnew, vnew)
        handle_mean = self._ax.plot(
            *xy,
            color=color,
            alpha=alpha,
            zorder=zorder,
            linestyle=linestyle,
            linewidth=linewidth,
        )
        color = handle_mean[0].get_color()  # type: ignore

        value_range = select_value_range(vmean, value_range, pad_frac=0.01)
        if not (self.vmin is not None and self.vmin < value_range[0]):
            self.vmin = value_range[0]
        if not (self.vmax is not None and self.vmax > value_range[1]):
            self.vmax = value_range[1]

        if show_error and vp.error is not None:
            verror = vp.error.flatten()
            if show_steps:
                verror, _ = _convert_vertical_profile_to_step_function(verror, h)
            handle_std = self.ax_fill_between(
                hnew,
                vnew - verror,
                vnew + verror,
                alpha=ribbon_alpha,
                color=color,
                linewidth=0,
            )

    if show_sem:
        vsem = nan_sem(vp.values, axis=0)
        if show_steps:
            vsem, _ = _convert_vertical_profile_to_step_function(vsem, h)
        handle_sem = self.ax_fill_between(
            hnew,
            vnew - vsem,
            vnew + vsem,
            alpha=ribbon_alpha,
            color=color,
            linewidth=0,
        )
    elif show_std:
        vstd = nan_std(vp.values, axis=0)
        if show_steps:
            vstd, _ = _convert_vertical_profile_to_step_function(vstd, h)
        handle_std = self.ax_fill_between(
            hnew,
            vnew - vstd,
            vnew + vstd,
            alpha=ribbon_alpha,
            color=color,
            linewidth=0,
        )

    if show_min:
        vmin = nan_min(vp.values, axis=0)
        vnew, hnew = vmin, h
        if show_steps:
            vnew, hnew = _convert_vertical_profile_to_step_function(vmin, h)
        xy = (vnew, hnew) if self.height_axis == "y" else (hnew, vnew)
        handle_min = self._ax.plot(
            *xy,
            color=color,
            alpha=alpha,
            zorder=zorder,
            linestyle="dashed",
            linewidth=linewidth,
        )
        color = handle_min[0].get_color()  # type: ignore

    if show_max:
        vmax = nan_max(vp.values, axis=0)
        vnew, hnew = vmax, h
        if show_steps:
            vnew, hnew = _convert_vertical_profile_to_step_function(vmax, h)
        xy = (vnew, hnew) if self.height_axis == "y" else (hnew, vnew)
        handle_max = self._ax.plot(
            *xy,
            color=color,
            alpha=alpha,
            zorder=zorder,
            linestyle="dashed",
            linewidth=linewidth,
        )
        color = handle_max[0].get_color()  # type: ignore

    # Legend labels
    if isinstance(legend_label, str):
        handle_std

        _handle: tuple | list = [
            *handle_mean,
            handle_std,
            handle_sem,
            *handle_min,
            *handle_max,
        ]
        _default_h = next(_h for _h in _handle if _h is not None)
        _handle = tuple([_h if _h is not None else _default_h for _h in _handle])
        self._legend_handles.append(_handle)
        self._legend_labels.append(legend_label)

    if selection_height_range:
        _shr: tuple[float, float] = validate_numeric_range(selection_height_range)
        _highlight_height_range(
            ax=self._ax,
            height_range=_shr,
        )

    self._init_axes()

    # format_height_ticks(self._ax, axis=self.height_axis)
    # format_numeric_ticks(self._ax, axis=self.value_axis, label=self.label)

    return self

remove_colorbar

remove_colorbar() -> None

Remove the colorbar from the figure, if present.

Source code in earthcarekit/plot/figure/_figure/base.py
def remove_colorbar(self) -> None:
    """Remove the colorbar from the figure, if present."""
    if self._colorbar:
        self._colorbar.remove()
        self._colorbar = None

remove_legend

remove_legend() -> None

Remove the legend from the figure, if present.

Source code in earthcarekit/plot/figure/_figure/base.py
def remove_legend(self) -> None:
    """Remove the legend from the figure, if present."""
    if self._legend:
        self._legend.remove()
        self._legend = None

save

save(
    filename: str = "",
    filepath: str | None = None,
    ds: Dataset | None = None,
    ds_filepath: str | None = None,
    dpi: float | Literal["figure"] = "figure",
    orbit_and_frame: str | None = None,
    utc_timestamp: TimestampLike | None = None,
    use_utc_creation_timestamp: bool = False,
    site_name: str | None = None,
    hmax: int | float | None = None,
    radius: int | float | None = None,
    extra: str | None = None,
    transparent_outside: bool = False,
    verbose: bool = True,
    print_prefix: str = "",
    create_dirs: bool = False,
    transparent_background: bool = False,
    resolution: str | None = None,
    **kwargs
) -> None

Save a figure as an image or vector graphic to a file and optionally format the file name in a structured way using EarthCARE metadata.

Parameters:

Name Type Description Default
filename str

The base name of the file. Can be extended based on other metadata provided. Defaults to empty string.

''
filepath str | None

The path where the image is saved. Can be extended based on other metadata provided. Defaults to None.

None
ds Dataset | None

A EarthCARE dataset from which metadata will be taken. Defaults to None.

None
ds_filepath str | None

A path to a EarthCARE product from which metadata will be taken. Defaults to None.

None
dpi float | figure

The resolution in dots per inch. If 'figure', use the figure's dpi value. Defaults to None.

'figure'
orbit_and_frame str | None

Metadata used in the formatting of the file name. Defaults to None.

None
utc_timestamp TimestampLike | None

Metadata used in the formatting of the file name. Defaults to None.

None
use_utc_creation_timestamp bool

Whether the time of image creation should be included in the file name. Defaults to False.

False
site_name str | None

Metadata used in the formatting of the file name. Defaults to None.

None
hmax int | float | None

Metadata used in the formatting of the file name. Defaults to None.

None
radius int | float | None

Metadata used in the formatting of the file name. Defaults to None.

None
resolution str | None

Metadata used in the formatting of the file name. Defaults to None.

None
extra str | None

A custom string to be included in the file name. Defaults to None.

None
transparent_outside bool

Whether the area outside figures should be transparent. Defaults to False.

False
verbose bool

Whether the progress of image creation should be printed to the console. Defaults to True.

True
print_prefix str

A prefix string to all console messages. Defaults to "".

''
create_dirs bool

Whether images should be saved in a folder structure based on provided metadata. Defaults to False.

False
transparent_background bool

Whether the background inside and outside of figures should be transparent. Defaults to False.

False
**kwargs dict[str, Any]

Keyword arguments passed to wrapped function call of matplotlib.pyplot.savefig.

{}
Source code in earthcarekit/plot/figure/_figure/base.py
def save(
    self: Self,
    filename: str = "",
    filepath: str | None = None,
    ds: xr.Dataset | None = None,
    ds_filepath: str | None = None,
    dpi: float | Literal["figure"] = "figure",
    orbit_and_frame: str | None = None,
    utc_timestamp: TimestampLike | None = None,
    use_utc_creation_timestamp: bool = False,
    site_name: str | None = None,
    hmax: int | float | None = None,
    radius: int | float | None = None,
    extra: str | None = None,
    transparent_outside: bool = False,
    verbose: bool = True,
    print_prefix: str = "",
    create_dirs: bool = False,
    transparent_background: bool = False,
    resolution: str | None = None,
    **kwargs,
) -> None:
    """Save a figure as an image or vector graphic to a file and optionally
    format the file name in a structured way using EarthCARE metadata.

    Args:
        filename (str, optional):
            The base name of the file. Can be extended based on other metadata provided.
            Defaults to empty string.
        filepath (str | None, optional):
            The path where the image is saved. Can be extended based on other metadata
            provided. Defaults to None.
        ds (xr.Dataset | None, optional):
            A EarthCARE dataset from which metadata will be taken. Defaults to None.
        ds_filepath (str | None, optional):
            A path to a EarthCARE product from which metadata will be taken. Defaults to None.
        dpi (float | 'figure', optional):
            The resolution in dots per inch. If 'figure', use the figure's dpi value.
            Defaults to None.
        orbit_and_frame (str | None, optional):
            Metadata used in the formatting of the file name. Defaults to None.
        utc_timestamp (TimestampLike | None, optional):
            Metadata used in the formatting of the file name. Defaults to None.
        use_utc_creation_timestamp (bool, optional):
            Whether the time of image creation should be included in the file name.
            Defaults to False.
        site_name (str | None, optional):
            Metadata used in the formatting of the file name. Defaults to None.
        hmax (int | float | None, optional):
            Metadata used in the formatting of the file name. Defaults to None.
        radius (int | float | None, optional):
            Metadata used in the formatting of the file name. Defaults to None.
        resolution (str | None, optional):
            Metadata used in the formatting of the file name. Defaults to None.
        extra (str | None, optional):
            A custom string to be included in the file name. Defaults to None.
        transparent_outside (bool, optional):
            Whether the area outside figures should be transparent. Defaults to False.
        verbose (bool, optional):
            Whether the progress of image creation should be printed to the console.
            Defaults to True.
        print_prefix (str, optional):
            A prefix string to all console messages. Defaults to "".
        create_dirs (bool, optional):
            Whether images should be saved in a folder structure based on provided metadata.
            Defaults to False.
        transparent_background (bool, optional):
            Whether the background inside and outside of figures should be transparent.
            Defaults to False.
        **kwargs (dict[str, Any]):
            Keyword arguments passed to wrapped function call of `matplotlib.pyplot.savefig`.
    """
    save_plot(
        fig=self.fig,
        filename=filename,
        filepath=filepath,
        ds=ds,
        ds_filepath=ds_filepath,
        dpi=dpi,
        orbit_and_frame=orbit_and_frame,
        utc_timestamp=utc_timestamp,
        use_utc_creation_timestamp=use_utc_creation_timestamp,
        site_name=site_name,
        hmax=hmax,
        radius=radius,
        extra=extra,
        transparent_outside=transparent_outside,
        verbose=verbose,
        print_prefix=print_prefix,
        create_dirs=create_dirs,
        transparent_background=transparent_background,
        resolution=resolution,
        **kwargs,
    )

set_colorbar_tick_scale

set_colorbar_tick_scale(
    multiplier: float | None = None, fontsize: float | str | None = None
) -> Self

Configure the scale of the colorbar tick lables, if present.

Source code in earthcarekit/plot/figure/_figure/base.py
def set_colorbar_tick_scale(
    self: Self,
    multiplier: float | None = None,
    fontsize: float | str | None = None,
) -> Self:
    """Configure the scale of the colorbar tick lables, if present."""
    if not isinstance(self._colorbar, Colorbar) or (multiplier is None and fontsize is None):
        return self

    if fontsize is None:
        ticklabels = self._colorbar.ax.yaxis.get_ticklabels()
        if len(ticklabels) == 0:
            ticklabels = self._colorbar.ax.xaxis.get_ticklabels()
        if len(ticklabels) == 0:
            return self
        fontsize = ticklabels[0].get_fontsize()

    if isinstance(fontsize, str):
        fontsize = font_manager.FontProperties(size=fontsize).get_size_in_points()

    if multiplier is not None:
        fontsize *= multiplier

    self._colorbar.ax.tick_params(labelsize=fontsize)

    return self

set_grid

set_grid(
    visible: bool | None = None,
    which: Literal["major", "minor", "both"] | None = None,
    axis: Literal["both", "x", "y"] | None = None,
    color: ColorLike | None = None,
    alpha: float = 1.0,
    linestyle: LineStyleType | None = None,
    linewidth: float | None = None,
    **kwargs
) -> Self

Configure the grid lines of the main matplotlib axis.

Source code in earthcarekit/plot/figure/_figure/base.py
def set_grid(
    self: Self,
    visible: bool | None = None,
    which: Literal["major", "minor", "both"] | None = None,
    axis: Literal["both", "x", "y"] | None = None,
    color: ColorLike | None = None,
    alpha: float = 1.0,
    linestyle: LineStyleType | None = None,
    linewidth: float | None = None,
    **kwargs,
) -> Self:
    """Configure the grid lines of the main matplotlib axis."""
    update_if_not_none(
        d=self._grid_kwargs,
        updates=dict(
            visible=visible,
            which=which,
            axis=axis,
            color=Color.from_optional(color),
            alpha=alpha,
            linestyle=linestyle,
            linewidth=linewidth,
            **kwargs,
        ),
    )

    self._ax.grid(**self._grid_kwargs)

    return self

set_legend

set_legend(
    ax: Axes | None = None,
    loc: str | None = None,
    markerscale: float | None = None,
    frameon: bool | None = None,
    facecolor: ColorLike | None = None,
    edgecolor: ColorLike | None = None,
    framealpha: float | None = None,
    fancybox: bool | None = None,
    handlelength: float | None = None,
    handletextpad: float | None = None,
    borderaxespad: float | None = None,
    ncols: int | None = None,
    edgewidth: float | None = None,
    textcolor: ColorLike | None = None,
    textweight: int | str | None = None,
    textshadealpha: float | None = None,
    textshadewidth: float | None = None,
    textshadecolor: ColorLike | None = None,
    **kwargs
) -> Self

Configure the legend.

If no axis is given and a right-side axis is present (ax_right), the legend is attached to it so that it renders above all plot elements; otherwise, the main axis is used (ax).

Source code in earthcarekit/plot/figure/_figure/base.py
def set_legend(
    self: Self,
    ax: Axes | None = None,
    loc: str | None = None,
    markerscale: float | None = None,
    frameon: bool | None = None,
    facecolor: ColorLike | None = None,
    edgecolor: ColorLike | None = None,
    framealpha: float | None = None,
    fancybox: bool | None = None,
    handlelength: float | None = None,
    handletextpad: float | None = None,
    borderaxespad: float | None = None,
    ncols: int | None = None,
    edgewidth: float | None = None,
    textcolor: ColorLike | None = None,
    textweight: int | str | None = None,
    textshadealpha: float | None = None,
    textshadewidth: float | None = None,
    textshadecolor: ColorLike | None = None,
    **kwargs,
) -> Self:
    """Configure the legend.

    If no axis is given and a right-side axis is present (`ax_right`), the legend is attached
    to it so that it renders above all plot elements; otherwise, the main axis is used (`ax`).
    """
    self.remove_legend()

    update_if_not_none(
        d=self._legend_kwargs,
        updates=dict(
            loc=loc,
            markerscale=markerscale,
            frameon=frameon,
            facecolor=Color.from_optional(facecolor),
            edgecolor=Color.from_optional(edgecolor),
            framealpha=framealpha,
            fancybox=fancybox,
            handlelength=handlelength,
            handletextpad=handletextpad,
            borderaxespad=borderaxespad,
            ncols=ncols,
            **kwargs,
        ),
    )
    update_if_not_none(
        d=self._legend_style_kwargs,
        updates=dict(
            textcolor=Color.from_optional(textcolor),
            textweight=textweight,
            textshadealpha=textshadealpha,
            textshadewidth=textshadewidth,
            textshadecolor=Color.from_optional(textshadecolor),
            edgewidth=edgewidth,
        ),
    )

    _textcolor = self._legend_style_kwargs.get("textcolor", "black")
    _textweight = self._legend_style_kwargs.get("textweight", "normal")
    _textshadealpha = self._legend_style_kwargs.get("textshadealpha", 0.0)
    _textshadewidth = self._legend_style_kwargs.get("textshadewidth", 3.0)
    _textshadecolor = self._legend_style_kwargs.get("textshadecolor", "white")
    _edgewidth = self._legend_style_kwargs.get("edgewidth", 1.5)

    if len(self._legend_handles) > 0:
        _ax = ax or self._ax_right or self._ax
        self._legend = _ax.legend(
            self._legend_handles,
            self._legend_labels,
            **self._legend_kwargs,
            handler_map={tuple: HandlerTuple(ndivide=1)},
        )
        self._legend.get_frame().set_linewidth(_edgewidth)
        for text in self._legend.get_texts():
            text.set_color(_textcolor)
            text.set_fontweight(_textweight)

            if _textshadealpha > 0:
                text = add_shade_to_text(
                    text,
                    alpha=_textshadealpha,
                    linewidth=_textshadewidth,
                    color=_textshadecolor,
                )
    return self

show

show() -> None

Display figure in interactive frontends (e.g., IPython/jupyter notebooks).

Source code in earthcarekit/plot/figure/_figure/base.py
def show(self) -> None:
    """Display figure in interactive frontends (e.g., `IPython`/`jupyter` notebooks)."""
    import IPython
    from IPython.display import display

    if IPython.get_ipython() is not None:
        display(self.fig)
    else:
        plt.show()

show_legend

show_legend(*args, **kwargs) -> Self

Configure the legend.

Deprecated

Use set_legend() instead.

Source code in earthcarekit/plot/figure/_figure/base.py
def show_legend(self: Self, *args, **kwargs) -> Self:
    """Configure the legend.

    Deprecated:
        Use `set_legend()` instead.
    """
    import warnings

    warnings.warn(
        "'show_legend()' is deprecated; use 'set_legend()' instead.",
        DeprecationWarning,
        stacklevel=2,
    )
    return self.set_legend(*args, **kwargs)

to_texture

to_texture() -> Self

Convert the figure to a texture (i.e., remove all axis ticks, labels, annotations, and text).

Source code in earthcarekit/plot/figure/_figure/base.py
def to_texture(self) -> Self:
    """Convert the figure to a texture
    (i.e., remove all axis ticks, labels, annotations, and text).
    """
    for ax in (self._ax, self._ax_top, self._ax_right):
        remove_arists(ax)
        remove_axis_grid_ticks_labels(ax)

    remove_white_frame_around_figure(self.fig)
    remove_colorbar(self._colorbar)
    remove_legend(self._legend)

    return self

SwathFigure

Bases: TimeseriesFigure

TODO: documentation

Source code in earthcarekit/plot/figure/swath.py
 42
 43
 44
 45
 46
 47
 48
 49
 50
 51
 52
 53
 54
 55
 56
 57
 58
 59
 60
 61
 62
 63
 64
 65
 66
 67
 68
 69
 70
 71
 72
 73
 74
 75
 76
 77
 78
 79
 80
 81
 82
 83
 84
 85
 86
 87
 88
 89
 90
 91
 92
 93
 94
 95
 96
 97
 98
 99
100
101
102
103
104
105
106
107
108
109
110
111
112
113
114
115
116
117
118
119
120
121
122
123
124
125
126
127
128
129
130
131
132
133
134
135
136
137
138
139
140
141
142
143
144
145
146
147
148
149
150
151
152
153
154
155
156
157
158
159
160
161
162
163
164
165
166
167
168
169
170
171
172
173
174
175
176
177
178
179
180
181
182
183
184
185
186
187
188
189
190
191
192
193
194
195
196
197
198
199
200
201
202
203
204
205
206
207
208
209
210
211
212
213
214
215
216
217
218
219
220
221
222
223
224
225
226
227
228
229
230
231
232
233
234
235
236
237
238
239
240
241
242
243
244
245
246
247
248
249
250
251
252
253
254
255
256
257
258
259
260
261
262
263
264
265
266
267
268
269
270
271
272
273
274
275
276
277
278
279
280
281
282
283
284
285
286
287
288
289
290
291
292
293
294
295
296
297
298
299
300
301
302
303
304
305
306
307
308
309
310
311
312
313
314
315
316
317
318
319
320
321
322
323
324
325
326
327
328
329
330
331
332
333
334
335
336
337
338
339
340
341
342
343
344
345
346
347
348
349
350
351
352
353
354
355
356
357
358
359
360
361
362
363
364
365
366
367
368
369
370
371
372
373
374
375
376
377
378
379
380
381
382
383
384
385
386
387
388
389
390
391
392
393
394
395
396
397
398
399
400
401
402
403
404
405
406
407
408
409
410
411
412
413
414
415
416
417
418
419
420
421
422
423
424
425
426
427
428
429
430
431
432
433
434
435
436
437
438
439
440
441
442
443
444
445
446
447
448
449
450
451
452
453
454
455
456
457
458
459
460
461
462
463
464
465
466
467
468
469
470
471
472
473
474
475
476
477
478
479
480
481
482
483
484
485
486
487
488
489
490
491
492
493
494
495
496
497
498
499
500
501
502
503
504
505
506
507
508
509
510
511
512
513
514
515
516
517
518
519
520
521
522
523
524
525
526
527
528
529
530
531
532
533
534
535
536
537
538
539
540
541
542
543
544
545
546
547
548
549
550
551
552
553
554
555
556
557
558
559
560
561
562
563
564
565
566
567
568
569
570
571
572
573
574
575
576
577
578
579
580
class SwathFigure(TimeseriesFigure):
    """TODO: documentation"""

    def __init__(
        self: Self,
        ax: Axes | None = None,
        fig: Figure | None = None,
        figsize: tuple[float, float] = (FIGURE_WIDTH_SWATH, FIGURE_HEIGHT_SWATH),
        dpi: float | None = None,
        title: str | None = None,
        fig_height_scale: float = 1.0,
        fig_width_scale: float = 1.0,
        axes_rect: tuple[float, float, float, float] = (0.0, 0.0, 1.0, 1.0),
        show_grid: bool | None = False,
        grid_kwargs: dict[str, Any] = {},
        title_kwargs: dict[str, Any] = {},
        # base
        num_ticks: int = 10,
        ax_style_top: AlongTrackAxisStyle | str = "geo",
        ax_style_bottom: AlongTrackAxisStyle | str = "time",
        ax_style_y: Literal[
            "from_track_distance",
            "across_track_distance",
            "pixel",
        ] = "from_track_distance",
        show_y_right: bool = False,
        show_y_left: bool = True,
        # timeseries
        colorbar_tick_scale: float | None = None,
    ) -> None:
        super().__init__(
            ax=ax,
            fig=fig,
            figsize=figsize,
            dpi=dpi,
            title=title,
            fig_height_scale=fig_height_scale,
            fig_width_scale=fig_width_scale,
            axes_rect=axes_rect,
            show_grid=show_grid,
            grid_kwargs=grid_kwargs,
            title_kwargs=title_kwargs,
            num_ticks=num_ticks,
            ax_style_top=ax_style_top,
            ax_style_bottom=ax_style_bottom,
            ax_style_y=ax_style_y,
            show_y_right=show_y_right,
            show_y_left=show_y_left,
        )

        self.colorbar_tick_scale: float | None = colorbar_tick_scale
        self.selection_time_range: tuple[pd.Timestamp, pd.Timestamp] | None = None

        self.info_text: AnchoredText | None = None
        self.info_text_loc: str = "upper right"

    def _set_info_text_loc(self: Self, info_text_loc: str | None) -> None:
        if isinstance(info_text_loc, str):
            self.info_text_loc = info_text_loc

    def plot(
        self: Self,
        swath_data: Swath | None = None,
        *,
        values: NDArray | None = None,
        time: NDArray | None = None,
        nadir_index: int | None = None,
        latitude: NDArray | None = None,
        longitude: NDArray | None = None,
        # Common args for wrappers
        value_range: ValueRangeLike | None = None,
        log_scale: bool | None = None,
        norm: Normalize | None = None,
        time_range: TimeRangeLike | None = None,
        from_track_range: DistanceRangeLike | None = None,
        label: str | None = None,
        units: str | None = None,
        cmap: str | Colormap | None = None,
        colorbar: bool = True,
        colorbar_ticks: ArrayLike | None = None,
        colorbar_tick_labels: ArrayLike | None = None,
        colorbar_position: str | Literal["left", "right", "top", "bottom"] = "right",
        colorbar_alignment: str | Literal["left", "center", "right"] = "center",
        colorbar_width: float = DEFAULT_COLORBAR_WIDTH,
        colorbar_spacing: float = 0.2,
        colorbar_length_ratio: float | str = "100%",
        colorbar_label_outside: bool = True,
        colorbar_ticks_outside: bool = True,
        colorbar_ticks_both: bool = False,
        selection_time_range: TimeRangeLike | None = None,
        selection_color: str | None = Color("ec:earthcare"),
        selection_linestyle: str | None = "dashed",
        selection_linewidth: float | int | None = 2.5,
        selection_highlight: bool = False,
        selection_highlight_inverted: bool = True,
        selection_highlight_color: str = Color("white"),
        selection_highlight_alpha: float = 0.5,
        selection_max_time_margin: (TimedeltaLike | Sequence[TimedeltaLike] | None) = None,
        ax_style_top: AlongTrackAxisStyle | str | None = None,
        ax_style_bottom: AlongTrackAxisStyle | str | None = None,
        ax_style_y: (
            Literal["from_track_distance", "across_track_distance", "pixel"] | None
        ) = None,
        show_nadir: bool = True,
        nadir_color: ColorLike | None = "red",
        nadir_linewidth: int | float = 1.5,
        label_length: int = 25,
        mark_time: TimestampLike | Sequence[TimestampLike] | None = None,
        mark_time_color: (str | Color | Sequence[str | Color | None] | None) = None,
        mark_time_linestyle: str | Sequence[str] = "solid",
        mark_time_linewidth: float | Sequence[float] = 2.5,
        **kwargs,
    ) -> Self:
        self._update(
            selection_color=selection_color,
            selection_linestyle=selection_linestyle,
            selection_linewidth=selection_linewidth,
            selection_highlight=selection_highlight,
            selection_highlight_inverted=selection_highlight_inverted,
            selection_highlight_color=selection_highlight_color,
            selection_highlight_alpha=selection_highlight_alpha,
            mark_time=mark_time,
            mark_time_color=mark_time_color,
            mark_time_linestyle=mark_time_linestyle,
            mark_time_linewidth=mark_time_linewidth,
        )

        cmap = get_cmap(cmap)
        self._set_norm(
            norm=norm,
            value_range=value_range,
            log_scale=log_scale,
            cmap=cmap,
        )

        if isinstance(swath_data, Swath):
            values = swath_data.values
            time = swath_data.time
            nadir_index = swath_data.nadir_index
            latitude = swath_data.latitude
            longitude = swath_data.longitude
            label = swath_data.label
            units = swath_data.units
        elif (
            values is None
            or time is None
            or nadir_index is None
            or latitude is None
            or longitude is None
        ):
            raise ValueError(
                "Missing required arguments. Provide either a `SwathData` or all of `values`, `time`, `nadir_index`, `latitude` and `longitude`"
            )

        sd = Swath(
            values=np.asarray(values),
            time=np.asarray(time),
            latitude=np.asarray(latitude),
            longitude=np.asarray(longitude),
            nadir_index=nadir_index,
            label=label,
            units=units,
        )

        tmin_original = sd.time[0]
        tmax_original = sd.time[-1]

        from_track_range = self._get_y_range(
            y=sd.from_track_distance,
            y_range=from_track_range,
        )
        self._ymin, self._ymax = from_track_range
        sd = sd.select_from_track_range(from_track_range)

        self._set_selection_max_time_margin(selection_max_time_margin)
        self._set_selection_time_range(selection_time_range)
        time_range = self._get_time_range(
            time=sd.time,
            time_range=time_range,
        )
        self._tmin, self._tmax = time_range
        sd = sd.select_time_range(time_range)

        self._ax_style_y = ax_style_y or self._ax_style_y
        if self._ax_style_y == "from_track_distance":
            ydata = sd.from_track_distance
        elif self._ax_style_y == "across_track_distance":
            ydata = sd.across_track_distance
        elif self._ax_style_y == "pixel":
            ydata = np.arange(len(sd.from_track_distance))
        ynadir = ydata[sd.nadir_index]

        if len(sd.values.shape) == 3 and sd.values.shape[2] == 3:
            self._cmap_source = self.ax.pcolormesh(
                sd.time,
                ydata,
                sd.values,
                rasterized=True,
                **kwargs,
            )
        else:
            self._cmap_source = self.ax.pcolormesh(
                sd.time,
                ydata,
                sd.values.T,
                norm=self._norm,
                cmap=cmap,
                rasterized=True,
                **kwargs,
            )

            if colorbar:
                cb_kwargs = dict(
                    label=format_var_label(sd.label, sd.units, label_len=label_length),
                    position=colorbar_position,
                    alignment=colorbar_alignment,
                    width=colorbar_width,
                    spacing=colorbar_spacing,
                    length_ratio=colorbar_length_ratio,
                    label_outside=colorbar_label_outside,
                    ticks_outside=colorbar_ticks_outside,
                    ticks_both=colorbar_ticks_both,
                )
                if cmap.categorical:
                    self.set_colorbar(
                        cmap=cmap,
                        **cb_kwargs,  # type: ignore
                    )
                else:
                    self.set_colorbar(
                        ticks=colorbar_ticks,
                        tick_labels=colorbar_tick_labels,
                        **cb_kwargs,  # type: ignore
                    )

        if show_nadir:
            nadir_color = Color.from_optional(nadir_color)
            nadir_color_shade = "white"
            if isinstance(nadir_color, Color):
                nadir_color_shade = nadir_color.get_best_bw_contrast_color()
            self.ax.axhline(
                y=ynadir,
                color=nadir_color_shade,
                linestyle="solid",
                linewidth=nadir_linewidth * 2,
                alpha=0.3,
                zorder=10,
            )
            self.ax.axhline(
                y=ynadir,
                color=Color.from_optional(nadir_color),
                linestyle="dashed",
                linewidth=nadir_linewidth,
                zorder=10,
            )

        self._set_y_axes(self._ymin, self._ymax)
        self._set_time_axes(
            tmin=self._tmin,
            tmax=self._tmax,
            time=sd.time,
            tmin_original=tmin_original,
            tmax_original=tmax_original,
            longitude=sd.longitude[:, sd.nadir_index],
            latitude=sd.latitude[:, sd.nadir_index],
            ax_style_top=ax_style_top,
            ax_style_bottom=ax_style_bottom,
        )

        self._plot_selection()
        self._plot_time_marks()

        return self

    def plot_contour(
        self: Self,
        values: NDArray,
        time: NDArray,
        latitude: NDArray,
        longitude: NDArray,
        nadir_index: int,
        label_levels: list | NDArray | None = None,
        label_format: str | None = None,
        levels: list | NDArray | None = None,
        linewidths: int | float | list | NDArray | None = 1.5,
        linestyles: str | list | NDArray | None = "solid",
        colors: Color | str | list | NDArray | None = "black",
        zorder: int | float | None = 2,
        show_labels: bool = True,
    ) -> Self:
        """Adds contour lines to the plot."""
        values = np.asarray(values)
        time = np.asarray(time)
        latitude = np.asarray(latitude)
        longitude = np.asarray(longitude)

        sd = Swath(
            values=values,
            time=time,
            latitude=latitude,
            longitude=longitude,
            nadir_index=nadir_index,
        )

        if isinstance(colors, str):
            colors = Color.from_optional(colors)
        elif isinstance(colors, (Iterable, np.ndarray)):
            colors = [Color.from_optional(c) for c in colors]
        else:
            colors = Color.from_optional(colors)

        if self._ax_style_y == "from_track_distance":
            ydata = sd.from_track_distance
        elif self._ax_style_y == "across_track_distance":
            ydata = sd.across_track_distance
        elif self._ax_style_y == "pixel":
            ydata = np.arange(len(sd.from_track_distance))

        x = sd.time
        y = ydata
        z = sd.values.T

        if len(y.shape) == 2:
            y = y[len(y) // 2]

        cn = self.ax.contour(
            x,
            y,
            z,
            levels=levels,
            linewidths=linewidths,
            colors=colors,
            linestyles=linestyles,
            zorder=zorder,
        )

        if show_labels:
            labels: Iterable[float]
            if label_levels:
                labels = [lvl for lvl in label_levels if lvl in cn.levels]
            else:
                labels = cn.levels

            cl = self.ax.clabel(
                cn,
                labels,  # type: ignore
                inline=True,
                fmt=label_format,
                fontsize="small",
                zorder=zorder,
            )

            bold_font = font_manager.FontProperties(weight="bold")
            for text in cl:
                text.set_fontproperties(bold_font)

            for txt in cn.labelTexts:
                txt.set_rotation(0)

        return self

    def ecplot_coastline(
        self: Self,
        ds: xr.Dataset,
        var: str = "land_flag",
        *,
        time_var: str = TIME_VAR,
        lat_var: str = SWATH_LAT_VAR,
        lon_var: str = SWATH_LON_VAR,
        color: ColorLike = "#F3E490",
        linewidth: float | int = 0.5,
    ) -> Self:
        return self.plot_contour(
            values=ds[var].values,
            time=ds[time_var].values,
            latitude=ds[lat_var].values,
            longitude=ds[lon_var].values,
            nadir_index=int(ds.nadir_index.values),
            levels=[0, 1],
            colors=Color.from_optional(color),
            show_labels=False,
            linewidths=linewidth,
        )

    def ecplot(
        self: Self,
        ds: xr.Dataset,
        var: str,
        *,
        time_var: str = TIME_VAR,
        lat_var: str = SWATH_LAT_VAR,
        lon_var: str = SWATH_LON_VAR,
        track_lat_var: str = TRACK_LAT_VAR,
        track_lon_var: str = TRACK_LON_VAR,
        along_track_dim: str = ALONG_TRACK_DIM,
        site: SiteLike | None = None,
        radius_km: float = 100.0,
        mark_closest: bool = False,
        show_radius: bool = True,
        show_info: bool = True,
        show_info_orbit_and_frame: bool = True,
        show_info_file_type: bool = True,
        show_info_baseline: bool = True,
        info_text_orbit_and_frame: str | None = None,
        info_text_file_type: str | None = None,
        info_text_baseline: str | None = None,
        info_text_loc: str | None = None,
        # Common args for wrappers
        values: NDArray | None = None,
        time: NDArray | None = None,
        nadir_index: int | None = None,
        latitude: NDArray | None = None,
        longitude: NDArray | None = None,
        value_range: ValueRangeLike | Literal["default"] | None = "default",
        log_scale: bool | None = None,
        norm: Normalize | None = None,
        time_range: TimeRangeLike | None = None,
        from_track_range: DistanceRangeLike | None = None,
        label: str | None = None,
        units: str | None = None,
        cmap: str | Colormap | None = None,
        colorbar: bool = True,
        colorbar_ticks: ArrayLike | None = None,
        colorbar_tick_labels: ArrayLike | None = None,
        colorbar_position: str | Literal["left", "right", "top", "bottom"] = "right",
        colorbar_alignment: str | Literal["left", "center", "right"] = "center",
        colorbar_width: float = DEFAULT_COLORBAR_WIDTH,
        colorbar_spacing: float = 0.2,
        colorbar_length_ratio: float | str = "100%",
        colorbar_label_outside: bool = True,
        colorbar_ticks_outside: bool = True,
        colorbar_ticks_both: bool = False,
        selection_time_range: TimeRangeLike | None = None,
        selection_color: str | None = Color("ec:earthcare"),
        selection_linestyle: str | None = "dashed",
        selection_linewidth: float | int | None = 2.5,
        selection_highlight: bool = False,
        selection_highlight_inverted: bool = True,
        selection_highlight_color: str = Color("white"),
        selection_highlight_alpha: float = 0.5,
        ax_style_top: AlongTrackAxisStyle | str | None = None,
        ax_style_bottom: AlongTrackAxisStyle | str | None = None,
        ax_style_y: Literal["from_track_distance", "across_track_distance", "pixel"] | None = None,
        show_nadir: bool = True,
        nadir_color: ColorLike | None = "black",
        nadir_linewidth: int | float = 1.5,
        label_length: int = 25,
        mark_time: TimestampLike | Sequence[TimestampLike] | None = None,
        mark_time_color: (str | Color | Sequence[str | Color | None] | None) = None,
        mark_time_linestyle: str | Sequence[str] = "solid",
        mark_time_linewidth: float | Sequence[float] = 2.5,
        **kwargs,
    ) -> Self:
        # Collect all common args for wrapped plot function call
        local_args = locals()
        # Delete all args specific to this wrapper function
        del local_args["self"]
        del local_args["ds"]
        del local_args["var"]
        del local_args["time_var"]
        del local_args["lat_var"]
        del local_args["lon_var"]
        del local_args["track_lat_var"]
        del local_args["track_lon_var"]
        del local_args["along_track_dim"]
        del local_args["site"]
        del local_args["radius_km"]
        del local_args["mark_closest"]
        del local_args["show_radius"]
        del local_args["show_info"]
        del local_args["show_info_orbit_and_frame"]
        del local_args["show_info_file_type"]
        del local_args["show_info_baseline"]
        del local_args["info_text_orbit_and_frame"]
        del local_args["info_text_file_type"]
        del local_args["info_text_baseline"]
        del local_args["info_text_loc"]
        # Delete kwargs to then merge it with the residual common args
        del local_args["kwargs"]
        all_args = {**local_args, **kwargs}

        if all_args["values"] is None:
            all_args["values"] = ds[var].values
        if all_args["time"] is None:
            all_args["time"] = ds[time_var].values
        if all_args["nadir_index"] is None:
            all_args["nadir_index"] = get_nadir_index(ds)
        if all_args["latitude"] is None:
            all_args["latitude"] = ds[lat_var].values
        if all_args["longitude"] is None:
            all_args["longitude"] = ds[lon_var].values

        # Set default values depending on variable name
        if label is None:
            all_args["label"] = "Values" if not hasattr(ds[var], "long_name") else ds[var].long_name
        if units is None:
            all_args["units"] = "-" if not hasattr(ds[var], "units") else ds[var].units
        if isinstance(value_range, str) and value_range == "default":
            value_range = None
            all_args["value_range"] = None
            if log_scale is None and norm is None:
                all_args["norm"] = get_default_norm(var, file_type=ds)
        if cmap is None:
            all_args["cmap"] = get_default_cmap(var, file_type=ds)

        ds = ensure_updated_msi_rgb_if_required(ds, var, time_range, time_var=time_var)

        # Handle overpass
        all_args = self._add_overpass_marks(
            all_args=all_args,
            ds=ds,
            time_var=time_var,
            lat_var=track_lat_var,
            lon_var=track_lon_var,
            along_track_dim=along_track_dim,
            site=site,
            radius_km=radius_km,
            mark_closest=mark_closest,
            show_radius=show_radius,
        )

        self.plot(**all_args)

        self._set_info_text_loc(info_text_loc)
        if show_info:
            self.info_text = add_text_product_info(
                self.ax,
                ds,
                append_to=self.info_text,
                loc=self.info_text_loc,
                show_orbit_and_frame=show_info_orbit_and_frame,
                show_file_type=show_info_file_type,
                show_baseline=show_info_baseline,
                text_orbit_and_frame=info_text_orbit_and_frame,
                text_file_type=info_text_file_type,
                text_baseline=info_text_baseline,
            )

        return self

ax property

ax: Axes

The main matplotlib axis of the figure.

colorbar property

colorbar: Colorbar | None

The matplotlib colorbar, if present.

fig property

fig: Figure

The underlying matplotlib figure.

invert_xaxis

invert_xaxis() -> Self

Invert the x-axis.

Source code in earthcarekit/plot/figure/_figure/base.py
def invert_xaxis(self) -> Self:
    """Invert the x-axis."""
    self._ax.invert_xaxis()
    if self._ax_top:
        self._ax_top.invert_xaxis()
    return self

invert_yaxis

invert_yaxis() -> Self

Invert the y-axis.

Source code in earthcarekit/plot/figure/_figure/base.py
def invert_yaxis(self) -> Self:
    """Invert the y-axis."""
    self._ax.invert_yaxis()
    if self._ax_right:
        self._ax_right.invert_yaxis()
    return self

legend property

legend: Legend | None

The matplotlib legend, if present.

plot_contour

plot_contour(
    values: NDArray,
    time: NDArray,
    latitude: NDArray,
    longitude: NDArray,
    nadir_index: int,
    label_levels: list | NDArray | None = None,
    label_format: str | None = None,
    levels: list | NDArray | None = None,
    linewidths: int | float | list | NDArray | None = 1.5,
    linestyles: str | list | NDArray | None = "solid",
    colors: Color | str | list | NDArray | None = "black",
    zorder: int | float | None = 2,
    show_labels: bool = True,
) -> Self

Adds contour lines to the plot.

Source code in earthcarekit/plot/figure/swath.py
def plot_contour(
    self: Self,
    values: NDArray,
    time: NDArray,
    latitude: NDArray,
    longitude: NDArray,
    nadir_index: int,
    label_levels: list | NDArray | None = None,
    label_format: str | None = None,
    levels: list | NDArray | None = None,
    linewidths: int | float | list | NDArray | None = 1.5,
    linestyles: str | list | NDArray | None = "solid",
    colors: Color | str | list | NDArray | None = "black",
    zorder: int | float | None = 2,
    show_labels: bool = True,
) -> Self:
    """Adds contour lines to the plot."""
    values = np.asarray(values)
    time = np.asarray(time)
    latitude = np.asarray(latitude)
    longitude = np.asarray(longitude)

    sd = Swath(
        values=values,
        time=time,
        latitude=latitude,
        longitude=longitude,
        nadir_index=nadir_index,
    )

    if isinstance(colors, str):
        colors = Color.from_optional(colors)
    elif isinstance(colors, (Iterable, np.ndarray)):
        colors = [Color.from_optional(c) for c in colors]
    else:
        colors = Color.from_optional(colors)

    if self._ax_style_y == "from_track_distance":
        ydata = sd.from_track_distance
    elif self._ax_style_y == "across_track_distance":
        ydata = sd.across_track_distance
    elif self._ax_style_y == "pixel":
        ydata = np.arange(len(sd.from_track_distance))

    x = sd.time
    y = ydata
    z = sd.values.T

    if len(y.shape) == 2:
        y = y[len(y) // 2]

    cn = self.ax.contour(
        x,
        y,
        z,
        levels=levels,
        linewidths=linewidths,
        colors=colors,
        linestyles=linestyles,
        zorder=zorder,
    )

    if show_labels:
        labels: Iterable[float]
        if label_levels:
            labels = [lvl for lvl in label_levels if lvl in cn.levels]
        else:
            labels = cn.levels

        cl = self.ax.clabel(
            cn,
            labels,  # type: ignore
            inline=True,
            fmt=label_format,
            fontsize="small",
            zorder=zorder,
        )

        bold_font = font_manager.FontProperties(weight="bold")
        for text in cl:
            text.set_fontproperties(bold_font)

        for txt in cn.labelTexts:
            txt.set_rotation(0)

    return self

remove_colorbar

remove_colorbar() -> None

Remove the colorbar from the figure, if present.

Source code in earthcarekit/plot/figure/_figure/base.py
def remove_colorbar(self) -> None:
    """Remove the colorbar from the figure, if present."""
    if self._colorbar:
        self._colorbar.remove()
        self._colorbar = None

remove_legend

remove_legend() -> None

Remove the legend from the figure, if present.

Source code in earthcarekit/plot/figure/_figure/base.py
def remove_legend(self) -> None:
    """Remove the legend from the figure, if present."""
    if self._legend:
        self._legend.remove()
        self._legend = None

save

save(
    filename: str = "",
    filepath: str | None = None,
    ds: Dataset | None = None,
    ds_filepath: str | None = None,
    dpi: float | Literal["figure"] = "figure",
    orbit_and_frame: str | None = None,
    utc_timestamp: TimestampLike | None = None,
    use_utc_creation_timestamp: bool = False,
    site_name: str | None = None,
    hmax: int | float | None = None,
    radius: int | float | None = None,
    extra: str | None = None,
    transparent_outside: bool = False,
    verbose: bool = True,
    print_prefix: str = "",
    create_dirs: bool = False,
    transparent_background: bool = False,
    resolution: str | None = None,
    **kwargs
) -> None

Save a figure as an image or vector graphic to a file and optionally format the file name in a structured way using EarthCARE metadata.

Parameters:

Name Type Description Default
filename str

The base name of the file. Can be extended based on other metadata provided. Defaults to empty string.

''
filepath str | None

The path where the image is saved. Can be extended based on other metadata provided. Defaults to None.

None
ds Dataset | None

A EarthCARE dataset from which metadata will be taken. Defaults to None.

None
ds_filepath str | None

A path to a EarthCARE product from which metadata will be taken. Defaults to None.

None
dpi float | figure

The resolution in dots per inch. If 'figure', use the figure's dpi value. Defaults to None.

'figure'
orbit_and_frame str | None

Metadata used in the formatting of the file name. Defaults to None.

None
utc_timestamp TimestampLike | None

Metadata used in the formatting of the file name. Defaults to None.

None
use_utc_creation_timestamp bool

Whether the time of image creation should be included in the file name. Defaults to False.

False
site_name str | None

Metadata used in the formatting of the file name. Defaults to None.

None
hmax int | float | None

Metadata used in the formatting of the file name. Defaults to None.

None
radius int | float | None

Metadata used in the formatting of the file name. Defaults to None.

None
resolution str | None

Metadata used in the formatting of the file name. Defaults to None.

None
extra str | None

A custom string to be included in the file name. Defaults to None.

None
transparent_outside bool

Whether the area outside figures should be transparent. Defaults to False.

False
verbose bool

Whether the progress of image creation should be printed to the console. Defaults to True.

True
print_prefix str

A prefix string to all console messages. Defaults to "".

''
create_dirs bool

Whether images should be saved in a folder structure based on provided metadata. Defaults to False.

False
transparent_background bool

Whether the background inside and outside of figures should be transparent. Defaults to False.

False
**kwargs dict[str, Any]

Keyword arguments passed to wrapped function call of matplotlib.pyplot.savefig.

{}
Source code in earthcarekit/plot/figure/_figure/base.py
def save(
    self: Self,
    filename: str = "",
    filepath: str | None = None,
    ds: xr.Dataset | None = None,
    ds_filepath: str | None = None,
    dpi: float | Literal["figure"] = "figure",
    orbit_and_frame: str | None = None,
    utc_timestamp: TimestampLike | None = None,
    use_utc_creation_timestamp: bool = False,
    site_name: str | None = None,
    hmax: int | float | None = None,
    radius: int | float | None = None,
    extra: str | None = None,
    transparent_outside: bool = False,
    verbose: bool = True,
    print_prefix: str = "",
    create_dirs: bool = False,
    transparent_background: bool = False,
    resolution: str | None = None,
    **kwargs,
) -> None:
    """Save a figure as an image or vector graphic to a file and optionally
    format the file name in a structured way using EarthCARE metadata.

    Args:
        filename (str, optional):
            The base name of the file. Can be extended based on other metadata provided.
            Defaults to empty string.
        filepath (str | None, optional):
            The path where the image is saved. Can be extended based on other metadata
            provided. Defaults to None.
        ds (xr.Dataset | None, optional):
            A EarthCARE dataset from which metadata will be taken. Defaults to None.
        ds_filepath (str | None, optional):
            A path to a EarthCARE product from which metadata will be taken. Defaults to None.
        dpi (float | 'figure', optional):
            The resolution in dots per inch. If 'figure', use the figure's dpi value.
            Defaults to None.
        orbit_and_frame (str | None, optional):
            Metadata used in the formatting of the file name. Defaults to None.
        utc_timestamp (TimestampLike | None, optional):
            Metadata used in the formatting of the file name. Defaults to None.
        use_utc_creation_timestamp (bool, optional):
            Whether the time of image creation should be included in the file name.
            Defaults to False.
        site_name (str | None, optional):
            Metadata used in the formatting of the file name. Defaults to None.
        hmax (int | float | None, optional):
            Metadata used in the formatting of the file name. Defaults to None.
        radius (int | float | None, optional):
            Metadata used in the formatting of the file name. Defaults to None.
        resolution (str | None, optional):
            Metadata used in the formatting of the file name. Defaults to None.
        extra (str | None, optional):
            A custom string to be included in the file name. Defaults to None.
        transparent_outside (bool, optional):
            Whether the area outside figures should be transparent. Defaults to False.
        verbose (bool, optional):
            Whether the progress of image creation should be printed to the console.
            Defaults to True.
        print_prefix (str, optional):
            A prefix string to all console messages. Defaults to "".
        create_dirs (bool, optional):
            Whether images should be saved in a folder structure based on provided metadata.
            Defaults to False.
        transparent_background (bool, optional):
            Whether the background inside and outside of figures should be transparent.
            Defaults to False.
        **kwargs (dict[str, Any]):
            Keyword arguments passed to wrapped function call of `matplotlib.pyplot.savefig`.
    """
    save_plot(
        fig=self.fig,
        filename=filename,
        filepath=filepath,
        ds=ds,
        ds_filepath=ds_filepath,
        dpi=dpi,
        orbit_and_frame=orbit_and_frame,
        utc_timestamp=utc_timestamp,
        use_utc_creation_timestamp=use_utc_creation_timestamp,
        site_name=site_name,
        hmax=hmax,
        radius=radius,
        extra=extra,
        transparent_outside=transparent_outside,
        verbose=verbose,
        print_prefix=print_prefix,
        create_dirs=create_dirs,
        transparent_background=transparent_background,
        resolution=resolution,
        **kwargs,
    )

set_colorbar_tick_scale

set_colorbar_tick_scale(
    multiplier: float | None = None, fontsize: float | str | None = None
) -> Self

Configure the scale of the colorbar tick lables, if present.

Source code in earthcarekit/plot/figure/_figure/base.py
def set_colorbar_tick_scale(
    self: Self,
    multiplier: float | None = None,
    fontsize: float | str | None = None,
) -> Self:
    """Configure the scale of the colorbar tick lables, if present."""
    if not isinstance(self._colorbar, Colorbar) or (multiplier is None and fontsize is None):
        return self

    if fontsize is None:
        ticklabels = self._colorbar.ax.yaxis.get_ticklabels()
        if len(ticklabels) == 0:
            ticklabels = self._colorbar.ax.xaxis.get_ticklabels()
        if len(ticklabels) == 0:
            return self
        fontsize = ticklabels[0].get_fontsize()

    if isinstance(fontsize, str):
        fontsize = font_manager.FontProperties(size=fontsize).get_size_in_points()

    if multiplier is not None:
        fontsize *= multiplier

    self._colorbar.ax.tick_params(labelsize=fontsize)

    return self

set_grid

set_grid(
    visible: bool | None = None,
    which: Literal["major", "minor", "both"] | None = None,
    axis: Literal["both", "x", "y"] | None = None,
    color: ColorLike | None = None,
    alpha: float = 1.0,
    linestyle: LineStyleType | None = None,
    linewidth: float | None = None,
    **kwargs
) -> Self

Configure the grid lines of the main matplotlib axis.

Source code in earthcarekit/plot/figure/_figure/base.py
def set_grid(
    self: Self,
    visible: bool | None = None,
    which: Literal["major", "minor", "both"] | None = None,
    axis: Literal["both", "x", "y"] | None = None,
    color: ColorLike | None = None,
    alpha: float = 1.0,
    linestyle: LineStyleType | None = None,
    linewidth: float | None = None,
    **kwargs,
) -> Self:
    """Configure the grid lines of the main matplotlib axis."""
    update_if_not_none(
        d=self._grid_kwargs,
        updates=dict(
            visible=visible,
            which=which,
            axis=axis,
            color=Color.from_optional(color),
            alpha=alpha,
            linestyle=linestyle,
            linewidth=linewidth,
            **kwargs,
        ),
    )

    self._ax.grid(**self._grid_kwargs)

    return self

set_legend

set_legend(
    ax: Axes | None = None,
    loc: str | None = None,
    markerscale: float | None = None,
    frameon: bool | None = None,
    facecolor: ColorLike | None = None,
    edgecolor: ColorLike | None = None,
    framealpha: float | None = None,
    fancybox: bool | None = None,
    handlelength: float | None = None,
    handletextpad: float | None = None,
    borderaxespad: float | None = None,
    ncols: int | None = None,
    edgewidth: float | None = None,
    textcolor: ColorLike | None = None,
    textweight: int | str | None = None,
    textshadealpha: float | None = None,
    textshadewidth: float | None = None,
    textshadecolor: ColorLike | None = None,
    **kwargs
) -> Self

Configure the legend.

If no axis is given and a right-side axis is present (ax_right), the legend is attached to it so that it renders above all plot elements; otherwise, the main axis is used (ax).

Source code in earthcarekit/plot/figure/_figure/base.py
def set_legend(
    self: Self,
    ax: Axes | None = None,
    loc: str | None = None,
    markerscale: float | None = None,
    frameon: bool | None = None,
    facecolor: ColorLike | None = None,
    edgecolor: ColorLike | None = None,
    framealpha: float | None = None,
    fancybox: bool | None = None,
    handlelength: float | None = None,
    handletextpad: float | None = None,
    borderaxespad: float | None = None,
    ncols: int | None = None,
    edgewidth: float | None = None,
    textcolor: ColorLike | None = None,
    textweight: int | str | None = None,
    textshadealpha: float | None = None,
    textshadewidth: float | None = None,
    textshadecolor: ColorLike | None = None,
    **kwargs,
) -> Self:
    """Configure the legend.

    If no axis is given and a right-side axis is present (`ax_right`), the legend is attached
    to it so that it renders above all plot elements; otherwise, the main axis is used (`ax`).
    """
    self.remove_legend()

    update_if_not_none(
        d=self._legend_kwargs,
        updates=dict(
            loc=loc,
            markerscale=markerscale,
            frameon=frameon,
            facecolor=Color.from_optional(facecolor),
            edgecolor=Color.from_optional(edgecolor),
            framealpha=framealpha,
            fancybox=fancybox,
            handlelength=handlelength,
            handletextpad=handletextpad,
            borderaxespad=borderaxespad,
            ncols=ncols,
            **kwargs,
        ),
    )
    update_if_not_none(
        d=self._legend_style_kwargs,
        updates=dict(
            textcolor=Color.from_optional(textcolor),
            textweight=textweight,
            textshadealpha=textshadealpha,
            textshadewidth=textshadewidth,
            textshadecolor=Color.from_optional(textshadecolor),
            edgewidth=edgewidth,
        ),
    )

    _textcolor = self._legend_style_kwargs.get("textcolor", "black")
    _textweight = self._legend_style_kwargs.get("textweight", "normal")
    _textshadealpha = self._legend_style_kwargs.get("textshadealpha", 0.0)
    _textshadewidth = self._legend_style_kwargs.get("textshadewidth", 3.0)
    _textshadecolor = self._legend_style_kwargs.get("textshadecolor", "white")
    _edgewidth = self._legend_style_kwargs.get("edgewidth", 1.5)

    if len(self._legend_handles) > 0:
        _ax = ax or self._ax_right or self._ax
        self._legend = _ax.legend(
            self._legend_handles,
            self._legend_labels,
            **self._legend_kwargs,
            handler_map={tuple: HandlerTuple(ndivide=1)},
        )
        self._legend.get_frame().set_linewidth(_edgewidth)
        for text in self._legend.get_texts():
            text.set_color(_textcolor)
            text.set_fontweight(_textweight)

            if _textshadealpha > 0:
                text = add_shade_to_text(
                    text,
                    alpha=_textshadealpha,
                    linewidth=_textshadewidth,
                    color=_textshadecolor,
                )
    return self

show

show() -> None

Display figure in interactive frontends (e.g., IPython/jupyter notebooks).

Source code in earthcarekit/plot/figure/_figure/base.py
def show(self) -> None:
    """Display figure in interactive frontends (e.g., `IPython`/`jupyter` notebooks)."""
    import IPython
    from IPython.display import display

    if IPython.get_ipython() is not None:
        display(self.fig)
    else:
        plt.show()

show_legend

show_legend(*args, **kwargs) -> Self

Configure the legend.

Deprecated

Use set_legend() instead.

Source code in earthcarekit/plot/figure/_figure/base.py
def show_legend(self: Self, *args, **kwargs) -> Self:
    """Configure the legend.

    Deprecated:
        Use `set_legend()` instead.
    """
    import warnings

    warnings.warn(
        "'show_legend()' is deprecated; use 'set_legend()' instead.",
        DeprecationWarning,
        stacklevel=2,
    )
    return self.set_legend(*args, **kwargs)

to_texture

to_texture() -> Self

Convert the figure to a texture (i.e., remove all axis ticks, labels, annotations, and text).

Source code in earthcarekit/plot/figure/_figure/base.py
def to_texture(self) -> Self:
    """Convert the figure to a texture
    (i.e., remove all axis ticks, labels, annotations, and text).
    """
    for ax in (self._ax, self._ax_top, self._ax_right):
        remove_arists(ax)
        remove_axis_grid_ticks_labels(ax)

    remove_white_frame_around_figure(self.fig)
    remove_colorbar(self._colorbar)
    remove_legend(self._legend)

    return self

cmaps module-attribute

cmaps: dict[str, Colormap] = get_cmaps()

Dictionary of custom colormaps for earthcarekit.

create_column_figure_layout

create_column_figure_layout(
    ncols: int,
    single_figsize: tuple[float, float] = (3, 8),
    margin: float = 0.0,
    height_scale: float = 1.0,
    width_scale: float | list[float] = 1.0,
) -> FigureLayoutColumns

Creates a figure with multiple subfigures arranged as columns in a single row, each containing one Axes.

Parameters:

Name Type Description Default
ncols int

Number of subfigures (columns) to create.

required
single_figsize tuple[float, float]

Size (width, height) of each individual subfigure. Defaults to (3, 8).

(3, 8)

Returns:

Type Description
FigureLayoutColumns

tuple[Figure, list[Axes]]: The parent figure and a list of Axes objects, one for each subfigure.

Source code in earthcarekit/plot/figure/multi_panel/simple_columns.py
def create_column_figure_layout(
    ncols: int,
    single_figsize: tuple[float, float] = (3, 8),
    margin: float = 0.0,
    height_scale: float = 1.0,
    width_scale: float | list[float] = 1.0,
) -> FigureLayoutColumns:
    """
    Creates a figure with multiple subfigures arranged as columns in a single row, each containing one Axes.

    Args:
        ncols (int): Number of subfigures (columns) to create.
        single_figsize (tuple[float, float], optional): Size (width, height) of each individual subfigure.
            Defaults to (3, 8).

    Returns:
        tuple[Figure, list[Axes]]: The parent figure and a list of Axes objects, one for each subfigure.
    """
    if not isinstance(width_scale, list):
        width_scale = [width_scale] * ncols

    if not isinstance(width_scale, list) or len(width_scale) != ncols:
        raise ValueError(
            f"length of list width_scale ({len(width_scale)}) must match 'ncols' ({ncols}) or be scalar float"
        )

    fig: Figure = plt.figure(
        figsize=(
            np.sum(single_figsize[0] * np.array(width_scale)) + (ncols - 1) * margin,
            single_figsize[1] * height_scale,
        )
    )
    figs: np.ndarray
    if ncols == 1:
        figs = np.array([fig])
    else:
        width_ratios = [single_figsize[0]]
        for i in range(ncols - 1):
            width_ratios.extend([margin, single_figsize[0] * width_scale[i + 1]])

        figs = fig.subfigures(
            1,
            ncols + (ncols - 1),
            wspace=0.0,
            hspace=0.0,
            width_ratios=width_ratios,
        )
    axs: list[Axes] = [f.add_subplot([0, 0, 1, 1]) for i, f in enumerate(figs) if i % 2 == 0]

    return FigureLayoutColumns(fig=fig, axs=axs)

create_multi_figure_layout

create_multi_figure_layout(
    rows: Sequence[FigureType | int],
    zoom_rows: Sequence[FigureType | int] | None = None,
    profile_rows: Sequence[FigureType | int] | None = None,
    map_rows: Sequence[FigureType | int] | None = None,
    wspace: float | Sequence[float] = 1.2,
    hspace: float | Sequence[float] = 1.2,
    wmain: float = FIGURE_WIDTH_CURTAIN,
    hrow: float = FIGURE_HEIGHT_CURTAIN,
    hswath: float = FIGURE_HEIGHT_SWATH,
    hline: float = FIGURE_HEIGHT_LINE,
    wprofile: float = FIGURE_WIDTH_PROFILE,
    wmap: float = FIGURE_MAP_WIDTH,
    wzoom: float = FIGURE_WIDTH_CURTAIN / 3.0,
) -> FigureLayoutMapMainZoomProfile

Creates a complex figure layout with columns for map, main, zoom, and profile panels (in that order from left to right).

Each panel column can have a custom sequence of figure types (e.g., row heights), and the layout supports both uniform and per-gap horizontal/vertical spacing.

Parameters:

Name Type Description Default
main_rows Sequence[FigureType | int]

List of figure types for the rows of the main column.

required
zoom_rows Sequence[FigureType | int]

List of figure types for the rows in the optional zoom column.

None
profile_rows Sequence[FigureType | int]

List of figure types for the rows in the optional profile column.

None
map_rows Sequence[FigureType | int]

List of figure types for the rows in the optional map column.

None
wspace float | Sequence[float]

Horizontal spacing between columns. Can be a single value or list defining spacing before, between, and after columns.

1.2
hspace float | Sequence[float]

Vertical spacing between rows. Similar behavior as wspace.

1.2
wmain float

Width of the main column. Default is FIGURE_WIDTH_CURTAIN.

FIGURE_WIDTH_CURTAIN
hrow float

Height of a standard row. Default is FIGURE_HEIGHT_CURTAIN.

FIGURE_HEIGHT_CURTAIN
hswath float

Height of a SwathFigure-type row. Default is FIGURE_HEIGHT_SWATH.

FIGURE_HEIGHT_SWATH
wprofile float

Width of the profile column.

FIGURE_WIDTH_PROFILE
wmap float

Width of the map column.

FIGURE_MAP_WIDTH
wzoom float

Width of the zoom column.

FIGURE_WIDTH_CURTAIN / 3.0

Returns:

Name Type Description
tuple FigureLayoutMapMainZoomProfile

A tuple containing: - Figure: The matplotlib figure object. - Sequence[Axes]: Axes for map panels (may be empty). - Sequence[Axes]: Axes for main panels. - Sequence[Axes]: Axes for zoom panels (may be empty). - Sequence[Axes]: Axes for profile panels (may be empty).

Raises:

Type Description
ValueError

If the provided spacing sequences are of invalid length.

TypeError

If spacing arguments are of unsupported types.

Source code in earthcarekit/plot/figure/multi_panel/map_main_zoom_profile_figure.py
def create_multi_figure_layout(
    rows: Sequence[FigureType | int],
    zoom_rows: Sequence[FigureType | int] | None = None,
    profile_rows: Sequence[FigureType | int] | None = None,
    map_rows: Sequence[FigureType | int] | None = None,
    wspace: float | Sequence[float] = 1.2,
    hspace: float | Sequence[float] = 1.2,
    wmain: float = FIGURE_WIDTH_CURTAIN,
    hrow: float = FIGURE_HEIGHT_CURTAIN,
    hswath: float = FIGURE_HEIGHT_SWATH,
    hline: float = FIGURE_HEIGHT_LINE,
    wprofile: float = FIGURE_WIDTH_PROFILE,
    wmap: float = FIGURE_MAP_WIDTH,
    wzoom: float = FIGURE_WIDTH_CURTAIN / 3.0,
) -> FigureLayoutMapMainZoomProfile:
    """
    Creates a complex figure layout with columns for map, main, zoom, and profile panels (in that order from left to right).

    Each panel column can have a custom sequence of figure types (e.g., row heights), and the layout
    supports both uniform and per-gap horizontal/vertical spacing.

    Args:
        main_rows (Sequence[FigureType | int]): List of figure types for the rows of the main column.
        zoom_rows (Sequence[FigureType | int], optional): List of figure types for the rows in the optional zoom column.
        profile_rows (Sequence[FigureType | int], optional): List of figure types for the rows in the optional profile column.
        map_rows (Sequence[FigureType | int], optional): List of figure types for the rows in the optional map column.
        wspace (float | Sequence[float], optional): Horizontal spacing between columns. Can be a single value
            or list defining spacing before, between, and after columns.
        hspace (float | Sequence[float], optional): Vertical spacing between rows. Similar behavior as `wspace`.
        wmain (float, optional): Width of the main column. Default is `FIGURE_WIDTH_CURTAIN`.
        hrow (float, optional): Height of a standard row. Default is `FIGURE_HEIGHT_CURTAIN`.
        hswath (float, optional): Height of a `SwathFigure`-type row. Default is `FIGURE_HEIGHT_SWATH`.
        wprofile (float, optional): Width of the profile column.
        wmap (float, optional): Width of the map column.
        wzoom (float, optional): Width of the zoom column.

    Returns:
        tuple: A tuple containing:
            - Figure: The matplotlib figure object.
            - Sequence[Axes]: Axes for map panels (may be empty).
            - Sequence[Axes]: Axes for main panels.
            - Sequence[Axes]: Axes for zoom panels (may be empty).
            - Sequence[Axes]: Axes for profile panels (may be empty).

    Raises:
        ValueError: If the provided spacing sequences are of invalid length.
        TypeError: If spacing arguments are of unsupported types.
    """
    # Calculate number of columns
    is_map_col: bool = isinstance(map_rows, list) and len(map_rows) > 0
    is_main_col: bool = isinstance(rows, list) and len(rows) > 0
    is_zoom_col: bool = isinstance(zoom_rows, list) and len(zoom_rows) > 0
    is_profile_col: bool = isinstance(profile_rows, list) and len(profile_rows) > 0
    col_present: list[bool] = [is_map_col, is_main_col, is_zoom_col, is_profile_col]

    ncols: int = sum(col_present)

    # Calculate number of rows
    _add: dict[FigureType, int] = {
        FigureType.MAP_2_ROW: 2,
        FigureType.MAP_3_ROW: 3,
        FigureType.MAP_4_ROW: 4,
        FigureType.MAP_5_ROW: 5,
        FigureType.MAP_6_ROW: 6,
        FigureType.MAP_7_ROW: 7,
        FigureType.MAP_8_ROW: 8,
        FigureType.MAP_9_ROW: 9,
        FigureType.MAP_FULL_ROW: len(rows),
    }
    nrows_min: int = 0
    if isinstance(map_rows, list):
        for ft in map_rows:
            if ft == FigureType.MAP_FULL_ROW:
                nrows_min += max(len(rows) - nrows_min, 0)
            else:
                nrows_min += _add.get(ft, 1)

    nrows: int = max(nrows_min, len(rows))

    # Calulate spaces between figures
    def _calulate_spaces(
        space: float | Sequence[float],
        n: int,
        name: str,
        name_col_row: str,
    ) -> list[float]:
        if isinstance(space, Sequence):
            space = list(space)
            if len(space) < n - 1 or len(space) > n + 1:
                raise ValueError(
                    f"{name} was given as a list (size={len(space)}) and thus needs to have a size between number of {name_col_row} ({n}) -1 (i.e. only spaces between {name_col_row}) and +1 (i.e. spaces before, between and after {name_col_row})."
                )
            elif len(space) == n - 1:
                space = [0.0] + space + [0.0]
            elif len(space) == n:
                space = space + [0.0]
        elif isinstance(space, float):
            space = [0.0] + [space] * (n - 1) + [0.0]
        else:
            raise TypeError(
                f"{name} has wrong type '{type(space).__name__}'. expected types: '{float.__name__}' or ''{list.__name__}'[{float.__name__}]'"
            )
        return space

    wspace = _calulate_spaces(wspace, ncols, "wspace", "columns")
    hspace = _calulate_spaces(hspace, nrows, "hspace", "rows")

    # Calculate size ratios of figures
    def _get_ratios(
        ratios_figs: list[float],
        space: list[float],
    ) -> list[float]:
        assert len(space) == len(ratios_figs) + 1

        ratios: list[float] = []
        for i, r in enumerate(ratios_figs):
            ratios.append(space[i])
            ratios.append(r)
        ratios.append(space[-1])

        return ratios

    wratios_figs: list[float] = np.array([wmap, wmain, wzoom, wprofile])[col_present].tolist()
    hratios_figs: list[float] = []
    for fig_type in rows:
        if isinstance(fig_type, float):
            hratios_figs.append(fig_type)
        elif fig_type == FigureType.SWATH:
            hratios_figs.append(hswath)
        elif fig_type == FigureType.LINE:
            hratios_figs.append(hline)
        elif fig_type == FigureType.CURTAIN_75:
            hratios_figs.append(hrow * 0.75)
        elif fig_type == FigureType.CURTAIN_67:
            hratios_figs.append(hrow * 0.666666667)
        elif fig_type == FigureType.CURTAIN_50:
            hratios_figs.append(hrow * 0.50)
        elif fig_type == FigureType.CURTAIN_33:
            hratios_figs.append(hrow * 0.333333333)
        elif fig_type == FigureType.CURTAIN_25:
            hratios_figs.append(hrow * 0.25)
        else:
            hratios_figs.append(hrow)
    if len(rows) < nrows_min:
        for i in range(nrows_min - len(rows)):
            hratios_figs.append(hrow)

    wratios = _get_ratios(wratios_figs, wspace)
    hratios = _get_ratios(hratios_figs, hspace)

    # Create the figure
    wfig = sum(wratios)
    hfig = sum(hratios)
    figsize = (wfig, hfig)

    fig = plt.figure(figsize=figsize)

    # Create the grid layout
    gs = gridspec.GridSpec(
        nrows=len(hratios),
        ncols=len(wratios),
        width_ratios=wratios,
        height_ratios=hratios,
        figure=fig,
        wspace=0,
        hspace=0,
        bottom=0.0,
        top=1.0,
        right=1.0,
        left=0.0,
    )

    # Create the plots
    # Create maps
    current_col: int = 1
    current_row: int = 1
    axs_map: list[Axes] = []
    axs_main: list[Axes] = []
    axs_zoom: list[Axes] = []
    axs_profile: list[Axes] = []
    ax: Axes | None
    if isinstance(map_rows, list) and len(map_rows) > 0:
        for fig_type in map_rows:
            if fig_type == FigureType.MAP_2_ROW:
                last_row = current_row + (2 * 0) + 3
                ax = fig.add_subplot(gs[current_row:last_row, current_col])
                current_row += 2 * 1
            elif fig_type == FigureType.MAP_3_ROW:
                last_row = current_row + (2 * 1) + 3
                ax = fig.add_subplot(gs[current_row:last_row, current_col])
                current_row += 2 * 2
            elif fig_type == FigureType.MAP_4_ROW:
                last_row = current_row + (2 * 2) + 3
                ax = fig.add_subplot(gs[current_row:last_row, current_col])
                current_row += 2 * 3
            elif fig_type == FigureType.MAP_5_ROW:
                last_row = current_row + (2 * 3) + 3
                ax = fig.add_subplot(gs[current_row:last_row, current_col])
                current_row += 2 * 4
            elif fig_type == FigureType.MAP_6_ROW:
                last_row = current_row + (2 * 4) + 3
                ax = fig.add_subplot(gs[current_row:last_row, current_col])
                current_row += 2 * 5
            elif fig_type == FigureType.MAP_7_ROW:
                last_row = current_row + (2 * 5) + 3
                ax = fig.add_subplot(gs[current_row:last_row, current_col])
                current_row += 2 * 6
            elif fig_type == FigureType.MAP_8_ROW:
                last_row = current_row + (2 * 6) + 3
                ax = fig.add_subplot(gs[current_row:last_row, current_col])
                current_row += 2 * 7
            elif fig_type == FigureType.MAP_9_ROW:
                last_row = current_row + (2 * 7) + 3
                ax = fig.add_subplot(gs[current_row:last_row, current_col])
                current_row += 2 * 8
            elif fig_type == FigureType.MAP_FULL_ROW:
                last_row = 2 * len(rows)
                ax = fig.add_subplot(gs[current_row:last_row, current_col])
                current_row = last_row
            elif fig_type == FigureType.NONE:
                ax = None
            else:
                ax = fig.add_subplot(gs[current_row, current_col])
            if isinstance(ax, Axes):
                axs_map.append(ax)
            current_row += 2
        current_col += 2
        current_row = 1

    if isinstance(rows, list):
        for fig_type in rows:
            if fig_type == FigureType.NONE:
                ax = None
            else:
                ax = fig.add_subplot(gs[current_row, current_col])
            if isinstance(ax, Axes):
                axs_main.append(ax)
            current_row += 2
        current_col += 2
        current_row = 1

    if isinstance(zoom_rows, list) and len(zoom_rows) > 0:
        for fig_type in zoom_rows:
            if fig_type == FigureType.NONE:
                ax = None
            else:
                ax = fig.add_subplot(gs[current_row, current_col])
            if isinstance(ax, Axes):
                axs_zoom.append(ax)
            current_row += 2
        current_col += 2
        current_row = 1

    if isinstance(profile_rows, list) and len(profile_rows) > 0:
        for fig_type in profile_rows:
            if fig_type == FigureType.NONE:
                ax = None
            else:
                ax = fig.add_subplot(gs[current_row, current_col])
            if isinstance(ax, Axes):
                axs_profile.append(ax)
            current_row += 2
        current_col += 2
        current_row = 1

    return FigureLayoutMapMainZoomProfile(
        fig=fig,
        axs_map=axs_map,
        axs=axs_main,
        axs_zoom=axs_zoom,
        axs_profile=axs_profile,
    )

ecquicklook

ecquicklook(
    ds: Dataset | str,
    vars: str | list[str] | None = None,
    show_maps: bool = True,
    show_zoom: bool = False,
    show_profile: bool = True,
    site: SiteLike | None = None,
    radius_km: float = 100.0,
    time_range: TimeRangeLike | None = None,
    height_range: DistanceRangeNoneLike | None = None,
    ds_tropopause: Dataset | str | None = None,
    ds_elevation: Dataset | str | None = None,
    ds_temperature: Dataset | str | None = None,
    resolution: Literal["low", "medium", "high", "l", "m", "h"] = "medium",
    ds2: Dataset | str | None = None,
    ds_xmet: Dataset | str | None = None,
    logger: Logger | None = None,
    log_msg_prefix: str = "",
    selection_max_time_margin: TimedeltaLike | Sequence[TimedeltaLike] | None = None,
    show_steps: bool = DEFAULT_PROFILE_SHOW_STEPS,
    mode: Literal["fast", "exact"] = "fast",
    map_style: (
        str
        | Literal[
            "none",
            "stock_img",
            "gray",
            "osm",
            "satellite",
            "mtg",
            "msg",
            "blue_marble",
            "land_ocean",
            "land_ocean_lakes_rivers",
        ]
        | None
    ) = "blue_marble",
    curtain_kwargs: dict[str, Any] = {},
    map_kwargs: dict[str, Any] = {},
    profile_kwargs: dict[str, Any] = {},
) -> QuicklookFigure

Generate a preview visualization of an EarthCARE dataset with optional maps, zoomed views, and profiles.

Parameters:

Name Type Description Default
ds Dataset | str

EarthCARE dataset or path.

required
vars (str | list[str] | None, otional)

List of variable to plot. Automatically sets product-specific default list of variables if None.

None
show_maps bool

Whether to include map view. Dafaults to True.

True
show_zoom bool

Whether to show an additional column of zoomed plots. Defaults to False.

False
show_profile bool

Whether to include vertical profile plots. Dfaults to True.

True
site SiteLike | None

Ground site object or name identifier.

None
radius_km float

Search radius around site in kilometers. Defaults to 100.

100.0
time_range TimeRangeLike | None

Time range filter.

None
height_range DistanceRangeNoneLike | None

Height range in meters. Defaults to None.

None
ds_tropopause Dataset | str | None

Optional dataset or path containing tropopause data to add it to the plot.

None
ds_elevation Dataset | str | None

Optional dataset or path containing elevation data to add it to the plot.

None
ds_temperature Dataset | str | None

Optional dataset or path containing temperature data to add it to the plot.

None
resolution Literal['low', 'medium', 'high', 'l', 'm', 'h']

Resolution of A-PRO data. Defaults to "low".

'medium'
ds2 Dataset | str | None

Secondary dataset required for certain product quicklook (e.g., A-LAY products need A-NOM or A-EBD to serve as background curtain plots).

None
ds_xmet Dataset | str | None

Optional auxiliary meteorological dataset used to plot tropopause, elevation and temperature from.

None
logger Logger

Logger instance for output messages.

None
log_msg_prefix str

Prefix for log messages.

''
selection_max_time_margin TimedeltaLike | Sequence[TimedeltaLike] | None

Allowed time difference for selection.

None
show_steps bool

Whether to plot profiles as height bin step functions or instead plot only the line through bin centers. Defaults to True.

DEFAULT_PROFILE_SHOW_STEPS
mode Literal['fast', 'exact']

Processing mode.

'fast'
map_style str | Literal['none', 'stock_img', 'gray', 'osm', 'satellite', 'mtg', 'msg', 'blue_marble', 'land_ocean', 'land_ocean_lakes_rivers'] | None

Style of the background in the secondary/zoomed map. Defaults to "blue_marble".

'blue_marble'

Returns:

Name Type Description
_QuicklookResults QuicklookFigure

Object containing figures and metadata.

Source code in earthcarekit/plot/quicklook/_quicklook.py
def ecquicklook(
    ds: xr.Dataset | str,
    vars: str | list[str] | None = None,
    show_maps: bool = True,
    show_zoom: bool = False,
    show_profile: bool = True,
    site: SiteLike | None = None,
    radius_km: float = 100.0,
    time_range: TimeRangeLike | None = None,
    height_range: DistanceRangeNoneLike | None = None,
    ds_tropopause: xr.Dataset | str | None = None,
    ds_elevation: xr.Dataset | str | None = None,
    ds_temperature: xr.Dataset | str | None = None,
    resolution: Literal["low", "medium", "high", "l", "m", "h"] = "medium",
    ds2: xr.Dataset | str | None = None,
    ds_xmet: xr.Dataset | str | None = None,
    logger: Logger | None = None,
    log_msg_prefix: str = "",
    selection_max_time_margin: TimedeltaLike | Sequence[TimedeltaLike] | None = None,
    show_steps: bool = DEFAULT_PROFILE_SHOW_STEPS,
    mode: Literal["fast", "exact"] = "fast",
    map_style: (
        str
        | Literal[
            "none",
            "stock_img",
            "gray",
            "osm",
            "satellite",
            "mtg",
            "msg",
            "blue_marble",
            "land_ocean",
            "land_ocean_lakes_rivers",
        ]
        | None
    ) = "blue_marble",
    curtain_kwargs: dict[str, Any] = {},
    map_kwargs: dict[str, Any] = {},
    profile_kwargs: dict[str, Any] = {},
) -> QuicklookFigure:
    """
    Generate a preview visualization of an EarthCARE dataset with optional maps, zoomed views, and profiles.

    Args:
        ds (xr.Dataset | str): EarthCARE dataset or path.
        vars (str | list[str] | None, otional): List of variable to plot. Automatically sets product-specific default list of variables if None.
        show_maps (bool, optional): Whether to include map view. Dafaults to True.
        show_zoom (bool, optional): Whether to show an additional column of zoomed plots. Defaults to False.
        show_profile (bool, optional): Whether to include vertical profile plots. Dfaults to True.
        site (SiteLike | None, optional): Ground site object or name identifier.
        radius_km (float, optional): Search radius around site in kilometers. Defaults to 100.
        time_range (TimeRangeLike | None, optional): Time range filter.
        height_range (DistanceRangeNoneLike | None, optional): Height range in meters. Defaults to None.
        ds_tropopause (xr.Dataset | str | None, optional): Optional dataset or path containing tropopause data to add it to the plot.
        ds_elevation (xr.Dataset | str | None, optional): Optional dataset or path containing elevation data to add it to the plot.
        ds_temperature (xr.Dataset | str | None, optional): Optional dataset or path containing temperature data to add it to the plot.
        resolution (Literal["low", "medium", "high", "l", "m", "h"], optional): Resolution of A-PRO data. Defaults to "low".
        ds2 (xr.Dataset | str | None, optional): Secondary dataset required for certain product quicklook (e.g., A-LAY products need A-NOM or A-EBD to serve as background curtain plots).
        ds_xmet (xr.Dataset | str | None, optional): Optional auxiliary meteorological dataset used to plot tropopause, elevation and temperature from.
        logger (Logger, optional): Logger instance for output messages.
        log_msg_prefix (str, optional): Prefix for log messages.
        selection_max_time_margin (TimedeltaLike | Sequence[TimedeltaLike] | None, optional): Allowed time difference for selection.
        show_steps (bool, optional): Whether to plot profiles as height bin step functions or instead plot only the line through bin centers. Defaults to True.
        mode (Literal["fast", "exact"], optional): Processing mode.
        map_style (str | Literal["none", "stock_img", "gray", "osm", "satellite", "mtg", "msg", "blue_marble", "land_ocean", "land_ocean_lakes_rivers"] | None, optional):
            Style of the background in the secondary/zoomed map. Defaults to "blue_marble".

    Returns:
        _QuicklookResults: Object containing figures and metadata.
    """
    if isinstance(vars, str):
        vars = [vars]

    filepath: str | None = None
    if isinstance(ds, str):
        filepath = ds

    ds = read_product(ds, in_memory=True)
    file_type = FileType.from_input(ds)

    if isinstance(ds_xmet, (xr.Dataset, str)):
        ds_xmet = read_product(ds_xmet, in_memory=True)
        if file_type in [
            FileType.ATL_NOM_1B,
            FileType.ATL_FM__2A,
            FileType.ATL_AER_2A,
            FileType.ATL_EBD_2A,
            FileType.ATL_ICE_2A,
            FileType.ATL_TC__2A,
            FileType.ATL_CLA_2A,
            FileType.CPR_NOM_1B,
        ]:
            ds_xmet = rebin_xmet_to_vertical_track(ds_xmet, ds)

    ds_tropopause, ds_elevation, ds_temperature = _get_addon_ds(
        ds,
        filepath,
        ds_tropopause or ds_xmet,
        ds_elevation or ds_xmet,
        ds_temperature or ds_xmet,
    )

    kwargs = dict(
        ds=ds,
        vars=vars,
        show_maps=show_maps,
        show_zoom=show_zoom,
        show_profile=show_profile,
        site=site,
        radius_km=radius_km,
        time_range=time_range,
        height_range=height_range,
        ds_tropopause=ds_tropopause,
        ds_elevation=ds_elevation,
        ds_temperature=ds_temperature,
        logger=logger,
        log_msg_prefix=log_msg_prefix,
        selection_max_time_margin=selection_max_time_margin,
        mode=mode,
        map_style=map_style,
        curtain_kwargs=curtain_kwargs,
        map_kwargs=map_kwargs,
        profile_kwargs=profile_kwargs,
    )

    if file_type == FileType.ATL_NOM_1B:
        kwargs["show_steps"] = show_steps
        return ecquicklook_anom(**kwargs)  # type: ignore
    elif file_type == FileType.ATL_EBD_2A:
        kwargs["show_steps"] = show_steps
        kwargs["resolution"] = resolution
        return ecquicklook_aebd(**kwargs)  # type: ignore
    elif file_type == FileType.ATL_AER_2A:
        kwargs["show_steps"] = show_steps
        kwargs["resolution"] = resolution
        return ecquicklook_aaer(**kwargs)  # type: ignore
    elif file_type == FileType.ATL_TC__2A:
        return ecquicklook_atc(**kwargs)  # type: ignore
    elif file_type == FileType.ATL_CTH_2A:
        if ds2 is not None:
            ds2 = read_product(ds2, in_memory=True)
            file_type2 = FileType.from_input(ds2)
            if file_type2 in [
                FileType.ATL_NOM_1B,
                FileType.ATL_EBD_2A,
                FileType.ATL_AER_2A,
                FileType.ATL_TC__2A,
            ]:
                kwargs["ds_bg"] = ds2
                kwargs["resolution"] = resolution
                return ecquicklook_acth(**kwargs)  # type: ignore
            raise ValueError(
                f"There is no CTH background curtain plotting for {str(file_type2)} products. Use instead: {str(FileType.ATL_NOM_1B)}, {str(FileType.ATL_EBD_2A)}, {str(FileType.ATL_AER_2A)}, {str(FileType.ATL_TC__2A)}"
            )
        raise TypeError("""Missing dataset "ds2" to plot a background for the CTH""")
    elif file_type == FileType.CPR_FMR_2A:
        return ecquicklook_cfmr(**kwargs)  # type: ignore
    elif file_type == FileType.CPR_CD__2A:
        return ecquicklook_ccd(**kwargs)  # type: ignore
    elif file_type == FileType.CPR_CLD_2A:
        return ecquicklook_ccld(**kwargs)  # type: ignore
    elif file_type == FileType.CPR_TC__2A:
        return ecquicklook_ctc(**kwargs)  # type: ignore
    elif file_type == FileType.AC__TC__2B:
        return ecquicklook_actc(**kwargs)  # type: ignore
    elif file_type == FileType.ACM_CAP_2B:
        return ecquicklook_acmcap(**kwargs)  # type: ignore
    raise NotImplementedError()

ecquicklook_deep_convection

ecquicklook_deep_convection(
    mrgr: Dataset | str,
    cfmr: Dataset | str,
    ccd: Dataset | str,
    aebd: Dataset | str,
    xmet: Dataset | str | None = None,
    height_range: DistanceRangeLike | None = (-250, 20000.0),
    time_range: TimeRangeLike | None = None,
    info_text_loc: str | None = None,
    trim_to_frame: bool = False,
    mrgr_kwargs: dict[str, Any] | None = None,
    cfmr_kwargs: dict[str, Any] | None = None,
    ccd_kwargs: dict[str, Any] | None = None,
    aebd_kwargs: dict[str, Any] | None = None,
    map_kwargs: dict[str, Any] | None = None,
    marble_kwargs: dict[str, Any] | None = None,
    map_style: MapStyleLike = "gray",
    map_timestamp: TimestampLike | None = None,
    marble_style: MapStyleLike = "gray",
    marble_timestamp: TimestampLike | None = None,
    show_mrgr: bool = True,
    show_cfmr: bool = True,
    show_ccd: bool = True,
    show_aebd: bool = True,
    show_marble: bool | None = None,
    show_map: bool | None = None,
    show_maps: bool | None = None,
    small_marble: bool = False,
) -> QuicklookFigure

Creates a 4 panel quicklook of a storm or deep convective event, displaying:

  • 1st row: RGB image from MSI_RGR_1C
  • 2nd row: Radar reflectivity from CPR_FMR_2A
  • 3rd row: Doppler velocity from CPR_CD__2A
  • 4th row: Total attenuated backscatter from ATL_EBD_2A

Parameters:

Name Type Description Default
ds_mrgr Dataset

The MSI_RGR_1C product filepath or dataset.

required
ds_cfmr Dataset

The CPR_FMR_2A product filepath or dataset.

required
ds_ccd Dataset

The CPR_CD__2A product filepath or dataset.

required
ds_aebd Dataset

The ATL_EBD_2A product filepath or dataset.

required
ds_xmet Dataset | None

The AUX_MET_1D product filepath or dataset. If given, temperature contour lines will be added to the plots. Defaults to None.

required
height_range DistanceRangeLike | None

A height range (i.e., min, max) in meters. Defaults to (-250, 20e3).

(-250, 20000.0)
time_range TimeRangeLike | None

A time range to filter the displayed data. Defaults to None.

None
info_text_loc str | None

The positioning of the orbt, frame and product info text (e.g., "upper right"). Defaults to None.

None
trim_to_frame bool

Wether the read products should be trimmed to the EarthCARE frame bounds.

False
mrgr_kwargs dict[str, Any] | None

Additional keyword arguemnts passed to the SwathFigure.ecplot() function. Defaults to None.

None
cfmr_kwargs dict[str, Any] | None

Additional keyword arguemnts passed to the CurtainFigure.ecplot() function. Defaults to None.

None
ccd_kwargs dict[str, Any] | None

Additional keyword arguemnts passed to the CurtainFigure.ecplot() function. Defaults to None.

None
aebd_kwargs dict[str, Any] | None

Additional keyword arguemnts passed to the CurtainFigure.ecplot() function. Defaults to None.

None
map_kwargs dict[str, Any] | None

Additional keyword arguemnts passed to the MapFigure.ecplot() function. Defaults to None.

None
map_style MapStyleLike

Style of the map's background image. Defaults to "gray".

'gray'
map_timestamp TimeRangeLike | None

Time reference used for nightshade overlay. Defaults to None.

None
marble_style MapStyleLike

Style of the "marble" map's background image. Defaults to "gray".

'gray'
marble_timestamp TimeRangeLike | None

Time reference used for nightshade overlay for the "marble" map. Defaults to None.

None
show_mrgr bool

If True, displays the MSI_RGR_1C sub-figure. Defaults to True.

True
show_cfmr bool

If True, displays the CPR_FMR_2A sub-figure. Defaults to True.

True
show_ccd bool

If True, displays the CPR_CD__2A sub-figure. Defaults to True.

True
show_aebd bool

If True, displays the ATL_EBD_2A sub-figure. Defaults to True.

True
show_marble bool | None

If True, displays the "marble" sub-figure (MSI_RGR_1C-based). Defaults to None.

None
show_map bool | None

If True, displays the map sub-figure (MSI_RGR_1C-based). Defaults to None.

None
show_maps bool | None

If True, two maps will be plotted in column before the along-track plots. The first map shows the EC track on a global earth map (i.e., "marble"). The second map shows swath data from MSI_RGR_1C zoomed to the selected time_range. Defaults to None.

None
small_marble bool

If True, the size of the "marble" map will be reduced to the first figure row; otherwise it will take the space of the first two rows. Defaults to False.

False

Returns:

Name Type Description
QuicklookFigure QuicklookFigure

The quicklook object.

Examples:

import earthcarekit as eck

df = eck.search_product(
    file_type=["mrgr", "cfmr", "ccd", "aebd", "xmet"],
    orbit_and_frame="07590D",
).filter_latest()

fp_mrgr = df.filter_file_type("mrgr").filepath[-1]
fp_cfmr = df.filter_file_type("cfmr").filepath[-1]
fp_ccd = df.filter_file_type("ccd").filepath[-1]
fp_aebd = df.filter_file_type("aebd").filepath[-1]
fp_xmet = df.filter_file_type("xmet").filepath[-1]

ql = eck.ecquicklook_deep_convection(
    mrgr=fp_mrgr,
    cfmr=fp_cfmr,
    ccd=fp_ccd,
    aebd=fp_aebd,
    xmet=fp_xmet,
    time_range=("2025-09-28T18:27:10", None),
    info_text_loc="upper left",
)

ecquicklook_deep_convection.png

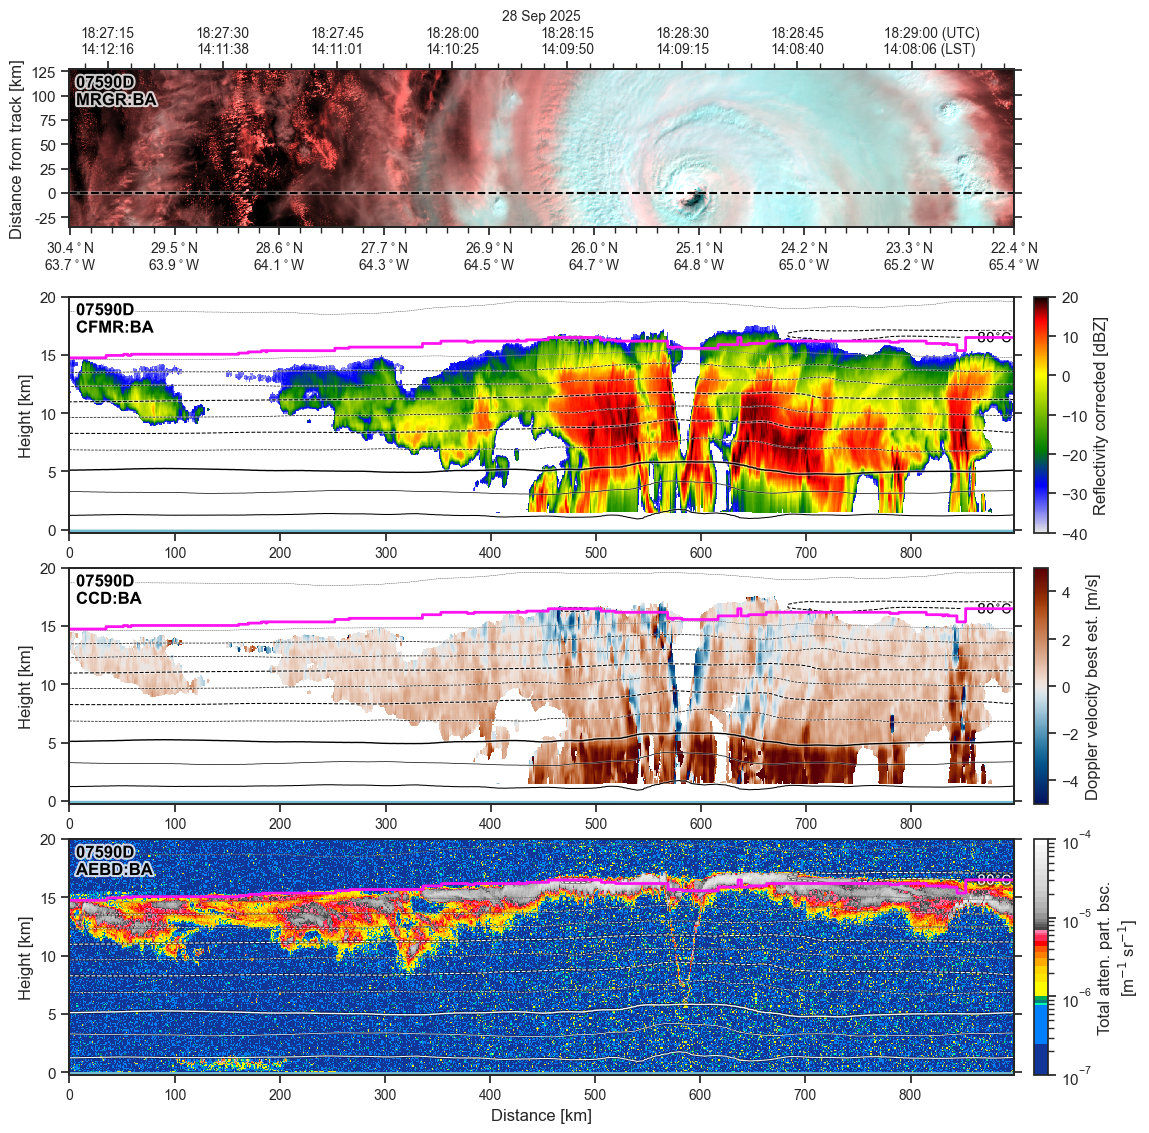
Source code in earthcarekit/plot/quicklook/_quicklook_deep_convection.py
def ecquicklook_deep_convection(
    mrgr: Dataset | str,
    cfmr: Dataset | str,
    ccd: Dataset | str,
    aebd: Dataset | str,
    xmet: Dataset | str | None = None,
    height_range: DistanceRangeLike | None = (-250, 20e3),
    time_range: TimeRangeLike | None = None,
    info_text_loc: str | None = None,
    trim_to_frame: bool = False,
    mrgr_kwargs: dict[str, Any] | None = None,
    cfmr_kwargs: dict[str, Any] | None = None,
    ccd_kwargs: dict[str, Any] | None = None,
    aebd_kwargs: dict[str, Any] | None = None,
    map_kwargs: dict[str, Any] | None = None,
    marble_kwargs: dict[str, Any] | None = None,
    map_style: MapStyleLike = "gray",
    map_timestamp: TimestampLike | None = None,
    marble_style: MapStyleLike = "gray",
    marble_timestamp: TimestampLike | None = None,
    show_mrgr: bool = True,
    show_cfmr: bool = True,
    show_ccd: bool = True,
    show_aebd: bool = True,
    show_marble: bool | None = None,
    show_map: bool | None = None,
    show_maps: bool | None = None,
    small_marble: bool = False,
) -> QuicklookFigure:
    """
    Creates a 4 panel quicklook of a storm or deep convective event, displaying:

    - 1st row: RGB image from MSI_RGR_1C
    - 2nd row: Radar reflectivity from CPR_FMR_2A
    - 3rd row: Doppler velocity from CPR_CD__2A
    - 4th row: Total attenuated backscatter from ATL_EBD_2A

    Args:
        ds_mrgr (Dataset):
            The MSI_RGR_1C product filepath or dataset.
        ds_cfmr (Dataset):
            The CPR_FMR_2A product filepath or dataset.
        ds_ccd (Dataset):
            The CPR_CD__2A product filepath or dataset.
        ds_aebd (Dataset):
            The ATL_EBD_2A product filepath or dataset.
        ds_xmet (Dataset | None, optional):
            The AUX_MET_1D product filepath or dataset.
            If given, temperature contour lines will be added to the plots. Defaults to None.
        height_range (DistanceRangeLike | None, optional):
            A height range (i.e., min, max) in meters. Defaults to (-250, 20e3).
        time_range (TimeRangeLike | None, optional):
            A time range to filter the displayed data. Defaults to None.
        info_text_loc (str | None, optional):
            The positioning of the orbt, frame and product info text (e.g., "upper right").
            Defaults to None.
        trim_to_frame (bool, optional):
            Wether the read products should be trimmed to the EarthCARE frame bounds.
        mrgr_kwargs (dict[str, Any] | None, optional):
            Additional keyword arguemnts passed to the `SwathFigure.ecplot()` function.
            Defaults to None.
        cfmr_kwargs (dict[str, Any] | None, optional):
            Additional keyword arguemnts passed to the `CurtainFigure.ecplot()` function.
            Defaults to None.
        ccd_kwargs (dict[str, Any] | None, optional):
            Additional keyword arguemnts passed to the `CurtainFigure.ecplot()` function.
            Defaults to None.
        aebd_kwargs (dict[str, Any] | None, optional):
            Additional keyword arguemnts passed to the `CurtainFigure.ecplot()` function.
            Defaults to None.
        map_kwargs (dict[str, Any] | None, optional):
            Additional keyword arguemnts passed to the `MapFigure.ecplot()` function.
            Defaults to None.
        map_style (MapStyleLike, optional):
            Style of the map's background image. Defaults to "gray".
        map_timestamp (TimeRangeLike | None, optional):
            Time reference used for nightshade overlay. Defaults to None.
        marble_style (MapStyleLike, optional):
            Style of the "marble" map's background image. Defaults to "gray".
        marble_timestamp (TimeRangeLike | None, optional):
            Time reference used for nightshade overlay for the "marble" map. Defaults to None.
        show_mrgr (bool, optional):
            If True, displays the MSI_RGR_1C sub-figure. Defaults to True.
        show_cfmr (bool, optional):
            If True, displays the CPR_FMR_2A sub-figure. Defaults to True.
        show_ccd (bool, optional):
            If True, displays the CPR_CD__2A sub-figure. Defaults to True.
        show_aebd (bool, optional):
            If True, displays the ATL_EBD_2A sub-figure. Defaults to True.
        show_marble (bool | None, optional):
            If True, displays the "marble" sub-figure (MSI_RGR_1C-based). Defaults to None.
        show_map (bool | None, optional):
            If True, displays the map sub-figure (MSI_RGR_1C-based). Defaults to None.
        show_maps (bool | None, optional):
            If True, two maps will be plotted in column before the along-track plots.
            The first map shows the EC track on a global earth map (i.e., "marble").
            The second map shows swath data from MSI_RGR_1C zoomed to the selected `time_range`.
            Defaults to None.
        small_marble (bool, optional):
            If True, the size of the "marble" map will be reduced to the first figure row;
            otherwise it will take the space of the first two rows. Defaults to False.

    Returns:
        QuicklookFigure: The quicklook object.

    Examples:
        ```python
        import earthcarekit as eck

        df = eck.search_product(
            file_type=["mrgr", "cfmr", "ccd", "aebd", "xmet"],
            orbit_and_frame="07590D",
        ).filter_latest()

        fp_mrgr = df.filter_file_type("mrgr").filepath[-1]
        fp_cfmr = df.filter_file_type("cfmr").filepath[-1]
        fp_ccd = df.filter_file_type("ccd").filepath[-1]
        fp_aebd = df.filter_file_type("aebd").filepath[-1]
        fp_xmet = df.filter_file_type("xmet").filepath[-1]

        ql = eck.ecquicklook_deep_convection(
            mrgr=fp_mrgr,
            cfmr=fp_cfmr,
            ccd=fp_ccd,
            aebd=fp_aebd,
            xmet=fp_xmet,
            time_range=("2025-09-28T18:27:10", None),
            info_text_loc="upper left",
        )
        ```

        ![ecquicklook_deep_convection.png](https://raw.githubusercontent.com/TROPOS-RSD/earthcarekit-docs-assets/refs/heads/main/assets/images/quicklooks/ecquicklook_deep_convection.png)
    """
    show_maps = show_maps or show_marble or show_map or False
    show_marble = show_marble or show_maps
    show_map = show_map or show_maps

    def _load_xmet() -> Dataset | None:
        if isinstance(xmet, Dataset):
            return xmet
        elif isinstance(xmet, str):
            return read_product(xmet)
        return None

    with (
        read_product(mrgr, trim_to_frame=trim_to_frame) as ds_mrgr,
        read_product(cfmr, trim_to_frame=trim_to_frame) as ds_cfmr,
        read_product(ccd, trim_to_frame=trim_to_frame) as ds_ccd,
        read_product(aebd, trim_to_frame=trim_to_frame) as ds_aebd,
        nullcontext(_load_xmet()) as ds_xmet,
    ):
        min_time = np.max(
            [
                np.min(ds_mrgr.time.values),
                np.min(ds_cfmr.time.values),
                np.min(ds_ccd.time.values),
                np.min(ds_aebd.time.values),
            ]
        )

        max_time = np.min(
            [
                np.max(ds_mrgr.time.values),
                np.max(ds_cfmr.time.values),
                np.max(ds_ccd.time.values),
                np.max(ds_aebd.time.values),
            ]
        )

        ds_mrgr = filter_time(ds_mrgr, (min_time, max_time))
        ds_cfmr = filter_time(ds_cfmr, (min_time, max_time))
        ds_ccd = filter_time(ds_ccd, (min_time, max_time))
        ds_aebd = filter_time(ds_aebd, (min_time, max_time))
        ds_xmet_vert: Dataset | None = None
        if isinstance(ds_xmet, Dataset):
            ds_xmet_vert = rebin_xmet_to_vertical_track(ds_xmet, ds_aebd)
            ds_xmet_vert = filter_time(ds_xmet_vert, time_range)

        map_rows = (
            [
                FigureType.MAP_1_ROW if small_marble else FigureType.MAP_2_ROW,
                FigureType.MAP_FULL_ROW,
            ]
            if show_maps
            else []
        )
        layout = create_multi_figure_layout(
            rows=[
                FigureType.SWATH,
                FigureType.CURTAIN_75,
                FigureType.CURTAIN_75,
                FigureType.CURTAIN_75,
            ],
            map_rows=map_rows,
            hspace=[0.7, 0.35, 0.35],
        )

        f: SwathFigure | CurtainFigure | MapFigure
        figs: list[ECKFigure] = []

        if show_maps:
            ax = layout.axs_map[0]
            if not show_marble:
                ax.remove()
            else:
                _marble_kwargs: dict[str, Any] = dict(
                    view="global",
                    time_range=time_range,
                    highlight_last=True,
                    highlight_first=False,
                    color=Color("ec:red").set_alpha(0.7),
                    color2="black",
                    linewidth2=1 if small_marble else 1.5,
                    linestyle2="dashed",
                    central_latitude=get_central_latitude(ds_mrgr.latitude.values),
                    central_longitude=get_central_longitude(ds_mrgr.longitude.values),
                    colorbar=False,
                    show_swath_border=False,
                )
                if marble_kwargs:
                    _marble_kwargs.update(marble_kwargs)
                f = MapFigure(
                    ax=ax,
                    show_grid_labels=False,
                    style=marble_style,
                    timestamp=marble_timestamp,
                )
                f.ecplot(ds=ds_mrgr, **_marble_kwargs)
                figs.append(f)

            ax = layout.axs_map[1]
            if not show_map:
                ax.remove()
            else:
                _map_kwargs: dict[str, Any] = dict(
                    style=map_style,
                    timestamp=map_timestamp,
                    show_right_labels=False,
                    show_bottom_labels=False,
                    show_text_frame=False,
                    show_text_time=False,
                )
                _mrgr_map_kwargs: dict[str, Any] = dict(
                    var="tir2",
                    cmap="msi_bt_enhanced",
                    show_nadir=False,
                    show_swath_border=False,
                    view="overpass",
                    time_range=time_range,
                    colorbar_position="bottom",
                    colorbar_spacing=0.1,
                )
                if map_kwargs:
                    if map_kwargs.get("var") != "tir2" and "cmap" not in map_kwargs:
                        map_kwargs["cmap"] = None
                    _mrgr_map_kwargs.update(map_kwargs)

                f = MapFigure(ax=ax, **_map_kwargs)
                f.ecplot(ds=ds_mrgr, **_mrgr_map_kwargs)
                figs.append(f)

        # 1. Row: MSI RGR RGB
        ax = layout.axs[0]
        if not show_mrgr:
            ax.remove()
        else:
            f = SwathFigure(ax=ax, ax_style_top="time", ax_style_bottom="geo")
            _mrgr_kwargs: dict[str, Any] = dict(
                var="rgb",
                time_range=time_range,
                info_text_loc=info_text_loc,
            )
            if mrgr_kwargs:
                _mrgr_kwargs.update(mrgr_kwargs)
            f = f.ecplot(ds=ds_mrgr, **_mrgr_kwargs)
            f = f.ecplot_coastline(ds_mrgr)
            figs.append(f)

        # 2. Row CPR FMR reflectivity (Range -40 - 20 dBz)
        ax = layout.axs[1]
        if not show_cfmr:
            ax.remove()
        else:
            f = CurtainFigure(
                ax=ax,
                ax_style_top="none",
                ax_style_bottom="distance_notitle",
            )
            _cfmr_kwargs: dict[str, Any] = dict(
                var="reflectivity_corrected",
                height_range=height_range,
                time_range=time_range,
                value_range=(-40, 20),
                info_text_loc=info_text_loc,
            )
            if cfmr_kwargs:
                _cfmr_kwargs.update(cfmr_kwargs)
            f = f.ecplot(ds=ds_cfmr, **_cfmr_kwargs)
            f = f.ecplot_elevation(ds_cfmr)
            f = f.ecplot_tropopause(ds_aebd)
            if isinstance(ds_xmet_vert, Dataset):
                f = f.ecplot_temperature(ds_xmet_vert)
            figs.append(f)

        # 3. Row CPR-CD Doppler Velocity best estimate (Range -5 -5 m/s)
        ax = layout.axs[2]
        if not show_ccd:
            ax.remove()
        else:
            f = CurtainFigure(
                ax=ax,
                ax_style_top="none",
                ax_style_bottom="distance_notitle",
            )
            _ccd_kwargs: dict[str, Any] = dict(
                var="doppler_velocity_best_estimate",
                height_range=height_range,
                time_range=time_range,
                value_range=(-5, 5),
                info_text_loc=info_text_loc,
            )
            if ccd_kwargs:
                _ccd_kwargs.update(ccd_kwargs)
            f = f.ecplot(ds=ds_ccd, **_ccd_kwargs)
            f = f.ecplot_elevation(ds_cfmr)
            f = f.ecplot_tropopause(ds_aebd)
            if isinstance(ds_xmet_vert, Dataset):
                f = f.ecplot_temperature(ds_xmet_vert)
            figs.append(f)

        # 4. Row ATL-EBD total attenuated mie backscatter
        ax = layout.axs[3]
        if not show_aebd:
            ax.remove()
        else:
            f = CurtainFigure(
                ax=ax,
                ax_style_top="none",
                ax_style_bottom="distance",
            )
            _aebd_kwargs: dict[str, Any] = dict(
                var="mie_total_attenuated_backscatter_355nm",
                height_range=height_range,
                time_range=time_range,
                info_text_loc=info_text_loc,
            )
            if aebd_kwargs:
                _aebd_kwargs.update(aebd_kwargs)
            f = f.ecplot(ds=ds_aebd, **_aebd_kwargs)
            f = f.ecplot_elevation(ds_cfmr)
            f = f.ecplot_tropopause(ds_aebd)
            if isinstance(ds_xmet_vert, Dataset):
                f = f.ecplot_temperature(ds_xmet_vert, colors="white")
            figs.append(f)

        return QuicklookFigure(
            fig=layout.fig,
            subfigs=[figs],
        )

ecquicklook_psc

ecquicklook_psc(
    anom: str | Sequence[str] | NDArray[str_] | Dataset,
    xmet: str | Sequence[str] | NDArray[str_] | Dataset | None = None,
    zoom_at: float | None = 0.5,
    height_range: DistanceRangeLike | None = (0, 40000.0),
    time_range: TimeRangeLike | None = None,
    info_text_loc: str | None = None,
) -> QuicklookFigure

Creates a two-column multi-panel quicklook of a PSC event, displaying:

  • 1st column: Two maps showing the EarthCARE track.
  • 2nd column: Three rows showing co- and cross-polar attenuated backscatter and the calculated depolarization ratio.

Parameters:

Name Type Description Default
anom str | Sequence[str] | Dataset

The ATL_NOM_1B product filepath(s) or dataset(s).

required
xmet str | Sequence[str] | Dataset | None

The AUX_MET_1D product filepath(s) or dataset(s). If given, temperature contour lines will be added to the plots. Defaults to None.

None
zoom_at float | None

In case two frames are given, selects only a zoomed-in portion of the frames around this fractional index (0 -> only 1st frame, 0.5 -> half of end of 1st and half of beginning of 2nd frame, 1 -> only 2nd frame). Defaults to 0.5.

0.5
height_range DistanceRangeLike | None

description. Defaults to (0, 40e3).

(0, 40000.0)
time_range TimeRangeLike | None

A time range to filter the displayed data. Defaults to None.

None
info_text_loc str | None

The positioning of the orbt, frame and product info text (e.g., "upper right"). Defaults to None.

None

Raises:

Type Description
ValueError

If none or more than 2 frames are given.

ValueError

If given number X-MET files does not match number of A-NOM files.

Returns:

Name Type Description
QuicklookFigure QuicklookFigure

The quicklook object.

Examples:

import earthcarekit as eck

df = eck.search_product(
    file_type=["anom", "xmet"],
    orbit_and_frame=["3579B", "3579C"],
).filter_latest()

fps_anom = df.filter_file_type("anom").filepath
fps_xmet = df.filter_file_type("xmet").filepath

ql = eck.ecquicklook_psc(
    anom=fps_anom,
    xmet=fps_xmet,
)

ecquicklook_psc.png

Source code in earthcarekit/plot/quicklook/_quicklook_psc.py
def ecquicklook_psc(
    anom: str | Sequence[str] | NDArray[np.str_] | Dataset,
    xmet: str | Sequence[str] | NDArray[np.str_] | Dataset | None = None,
    zoom_at: float | None = 0.5,
    height_range: DistanceRangeLike | None = (0, 40e3),
    time_range: TimeRangeLike | None = None,
    info_text_loc: str | None = None,
) -> QuicklookFigure:
    """
    Creates a two-column multi-panel quicklook of a PSC event, displaying:

    - 1st column: Two maps showing the EarthCARE track.
    - 2nd column: Three rows showing co- and cross-polar attenuated backscatter and the calculated depolarization ratio.

    Args:
        anom (str | Sequence[str] | Dataset):  The ATL_NOM_1B product filepath(s) or dataset(s).
        xmet (str | Sequence[str] | Dataset | None, optional): The AUX_MET_1D product filepath(s) or dataset(s).
            If given, temperature contour lines will be added to the plots. Defaults to None.
        zoom_at (float | None, optional): In case two frames are given, selects only a zoomed-in portion of the
            frames around this fractional index (0 -> only 1st frame, 0.5 -> half of end of 1st and half of beginning
            of 2nd frame, 1 -> only 2nd frame). Defaults to 0.5.
        height_range (DistanceRangeLike | None, optional): _description_. Defaults to (0, 40e3).
        time_range (TimeRangeLike | None, optional): A time range to filter the displayed data. Defaults to None.
        info_text_loc (str | None, optional): The positioning of the orbt, frame and product info text (e.g., "upper right").
            Defaults to None.

    Raises:
        ValueError: If none or more than 2 frames are given.
        ValueError: If given number X-MET files does not match number of A-NOM files.

    Returns:
        QuicklookFigure: The quicklook object.

    Examples:
        ```python
        import earthcarekit as eck

        df = eck.search_product(
            file_type=["anom", "xmet"],
            orbit_and_frame=["3579B", "3579C"],
        ).filter_latest()

        fps_anom = df.filter_file_type("anom").filepath
        fps_xmet = df.filter_file_type("xmet").filepath

        ql = eck.ecquicklook_psc(
            anom=fps_anom,
            xmet=fps_xmet,
        )
        ```

        ![ecquicklook_psc.png](https://raw.githubusercontent.com/TROPOS-RSD/earthcarekit-docs-assets/refs/heads/main/assets/images/quicklooks/ecquicklook_psc.png)
    """

    if not isinstance(anom, str) and isinstance(anom, (Sequence, np.ndarray)):
        if len(anom) == 0 or len(anom) > 2:
            raise ValueError(
                f"supports input of either 1 or 2 consecutive frames, but got {len(anom)} A-NOM frames"
            )
        if not isinstance(xmet, str) and isinstance(xmet, (Sequence, np.ndarray)):
            if len(anom) != len(xmet):
                raise ValueError(
                    f"number of X-MET frames ({len(xmet)}) must match number of A-NOM frames ({len(anom)})"
                )

    def _load_full_anom() -> Dataset:
        if isinstance(anom, Dataset):
            return anom
        elif isinstance(anom, str):
            return read_product(anom)
        return read_products(anom)

    def _load_anom() -> Dataset:
        if isinstance(anom, Dataset):
            return anom
        elif isinstance(anom, str):
            return read_product(anom)
        return read_products(anom, zoom_at=zoom_at)

    def _load_xmet() -> Dataset | None:
        if isinstance(xmet, Dataset):
            return xmet
        elif isinstance(xmet, str):
            return read_product(xmet)
        elif isinstance(xmet, (Sequence, np.ndarray)) and len(xmet) > 0:
            return read_product(xmet[0])
        return None

    def _load_xmet2() -> Dataset | None:
        if (
            not isinstance(xmet, Dataset)
            and not isinstance(xmet, str)
            and isinstance(xmet, (Sequence, np.ndarray))
            and len(xmet) > 1
        ):
            return read_product(xmet[1])
        return None

    with (
        _load_full_anom() as ds_full,
        _load_anom() as ds,
        nullcontext(_load_xmet()) as ds_xmet,
        nullcontext(_load_xmet2()) as ds_xmet2,
    ):
        if isinstance(ds_xmet, Dataset):
            ds_xmet = rebin_xmet_to_vertical_track(ds_xmet, ds_full)
            ds_xmet = filter_frame(ds_xmet)

            if isinstance(ds_xmet2, Dataset):
                ds_xmet2 = rebin_xmet_to_vertical_track(ds_xmet2, ds_full)
                ds_xmet2 = filter_frame(ds_xmet2)

                ds_xmet = concat_datasets(ds_xmet, ds_xmet2, "along_track")

        ds = filter_time(ds, time_range)

        figs: list[list[ECKFigure]] = [[], []]
        layout = create_multi_figure_layout(
            rows=[
                FigureType.CURTAIN,
                FigureType.CURTAIN,
                FigureType.CURTAIN,
            ],
            hspace=0.4,
            wspace=1.0,
            map_rows=[
                FigureType.MAP_1_ROW,
                FigureType.MAP_2_ROW,
            ],
        )

        mf1 = MapFigure(
            ax=layout.axs_map[0],
            show_grid_labels=False,
        )
        mf1.ecplot(ds)
        mf1.plot_track(
            latitude=ds_full.latitude.values,
            longitude=ds_full.longitude.values,
            color="white",
            linestyle="dashed",
            linewidth=1,
            zorder=2,
            highlight_first=False,
            highlight_last=False,
            alpha=0.8,
        )
        figs[0].append(mf1)

        mf2 = MapFigure(
            ax=layout.axs_map[1],
            show_top_labels=False,
            show_right_labels=False,
            style="blue_marble",
            coastlines_resolution="50m",
            show_text_time=False,
            show_text_frame=False,
        )
        mf2.ecplot(ds)
        mf2.plot_track(
            latitude=ds_full.latitude.values,
            longitude=ds_full.longitude.values,
            color="white",
            linestyle="dashed",
            linewidth=1,
            zorder=2,
            highlight_first=False,
            highlight_last=False,
            alpha=0.8,
        )

        coords = get_coords(ds)
        zoom_radius_meters = geodesic(coords[0], coords[-1], units="m") * 0.4
        mf2.ax.set_xlim(-zoom_radius_meters, zoom_radius_meters)  # type: ignore
        mf2.ax.set_ylim(-zoom_radius_meters, zoom_radius_meters)  # type: ignore
        figs[0].append(mf2)

        vars = [
            "mie_attenuated_backscatter",
            "crosspolar_attenuated_backscatter",
            "depol_ratio",
        ]

        for i, (var, ax) in enumerate(zip(vars, layout.axs)):
            if i == 0:
                ax_style_top = "utc"
                ax_style_bottom = "lat"
            elif i == 1:
                ax_style_top = "lat_nolabels"
                ax_style_bottom = "lon"
            elif i == 2:
                ax_style_top = "lon_nolabels"
                ax_style_bottom = "distance"

            cf = CurtainFigure(
                ax=ax,
                ax_style_top=ax_style_top,
                ax_style_bottom=ax_style_bottom,
                num_ticks=8,
            )
            cf.ecplot(
                ds=ds,
                var=var,
                label_length=55,
                height_range=height_range,
                info_text_loc=info_text_loc,
            )
            cf.ecplot_temperature(
                ds=ds,
                colors="#fffffff0",
                levels=[-90, -80, -60, -40, -20, 0, 10],
                label_levels=[-90, -80, -60, -40, -20, 0, 10],
                linestyles="solid",
                linewidths=[1, 0.7, 0.5, 1, 0.5, 1, 0.5],
            )
            if isinstance(ds_xmet, Dataset):
                cf.ecplot_tropopause(ds_xmet)
            figs[1].append(cf)

        return QuicklookFigure(
            fig=layout.fig,
            subfigs=figs,
        )

get_cmap

get_cmap(cmap: CmapLike | None, **kwargs) -> Cmap

Return a colormap given by cmap.

Parameters:

Name Type Description Default
cmap CmapLike | None
  • If a colormap, return it.
  • If a str, return first matching colormap from earthcarekit, cmcrameri, plotly, or matplotlib (in that order).
  • If a list of colors, create a corresponding descrete colormap.
  • If None, return the default colormap ("viridis").
required

Returns: Cmap: The resolved colormap.

Source code in earthcarekit/colormap/_get_cmap.py
def get_cmap(cmap: CmapLike | None, **kwargs) -> Cmap:
    """Return a colormap given by `cmap`.

    Args:
        cmap (CmapLike | None):
            - If a colormap, return it.
            - If a `str`, return first matching colormap from `earthcarekit`, `cmcrameri`,
              `plotly`, or `matplotlib` (in that order).
            - If a `list` of colors, create a corresponding descrete colormap.
            - If None, return the default colormap ("viridis").
    Returns:
        Cmap:
            The resolved colormap.
    """
    if isinstance(cmap, (str, Colormap)) or cmap is None:
        return _get_cmap(cmap, **kwargs)

    if len(kwargs) > 0:
        raise TypeError(f"get_cmap() got an unexpected keyword argument '{tuple(kwargs)[0]}'")

    if isinstance(cmap, Cmap):
        return cmap.copy()

    return Cmap.from_colormap(ListedColormap(cmap))

plot_line_between_figures

plot_line_between_figures(
    ax1: Axes,
    ax2: Axes,
    point1: _NumberTimeOrTuple,
    point2: _NumberTimeOrTuple | None = None,
    color: ColorLike | None = "ec:red",
    linestyle: str = "dashed",
    linewidth: int | float = 2,
    alpha: int | float = 0.3,
    capstyle: str = "butt",
    zorder: int | float = -20,
    **kwargs
) -> None

Draws a line connecting a point in one subfigure (ax1) to a point in another (ax2).

Source code in earthcarekit/plot/figure/_plot_line_between_figures.py
def plot_line_between_figures(
    ax1: Axes,
    ax2: Axes,
    point1: _NumberTimeOrTuple,
    point2: _NumberTimeOrTuple | None = None,
    color: ColorLike | None = "ec:red",
    linestyle: str = "dashed",
    linewidth: int | float = 2,
    alpha: int | float = 0.3,
    capstyle: str = "butt",
    zorder: int | float = -20,
    **kwargs,
) -> None:
    """Draws a line connecting a point in one subfigure (ax1) to a point in another (ax2)."""
    p1: tuple[float, float] = _get_point(ax1, 1, point1)
    if point2 is None:
        point2 = point1
    p2: tuple[float, float] = _get_point(ax2, 2, point2)

    con = ConnectionPatch(
        xyA=p1,
        coordsA=ax1.transData,
        xyB=p2,
        coordsB=ax2.transData,
        axesA=ax1,
        axesB=ax2,
        color=Color.from_optional(color),
        linestyle=linestyle,
        linewidth=linewidth,
        alpha=alpha,
        capstyle=capstyle,
        zorder=zorder,
        **kwargs,
    )
    ax1.figure.add_artist(con)

save_plot

save_plot(
    fig: Figure | HasFigure,
    filename: str = "",
    filepath: str | None = None,
    ds: Dataset | None = None,
    ds_filepath: str | None = None,
    pad: float = 0.1,
    dpi: float | Literal["figure"] = "figure",
    orbit_and_frame: str | None = None,
    utc_timestamp: TimestampLike | None = None,
    use_utc_creation_timestamp: bool = False,
    site_name: str | None = None,
    hmax: int | float | None = None,
    radius: int | float | None = None,
    resolution: str | None = None,
    extra: str | None = None,
    transparent_outside: bool = False,
    verbose: bool = True,
    print_prefix: str = "",
    create_dirs: bool = False,
    transparent_background: bool = False,
    **kwargs
) -> None

Save a figure as an image or vector graphic to a file and optionally format the file name in a structured way using EarthCARE metadata.

Parameters:

Name Type Description Default
fig Figure | HasFigure

A figure object (matplotlib.figure.Figure) or objects exposing a .fig attribute containing a figure (e.g., CurtainFigure).

required
filename str

The base name of the file. Can be extended based on other metadata provided. Defaults to empty string.

''
filepath str | None

The path where the image is saved. Can be extended based on other metadata provided. Defaults to None.

None
ds Dataset | None

A EarthCARE dataset from which metadata will be taken. Defaults to None.

None
ds_filepath str | None

A path to a EarthCARE product from which metadata will be taken. Defaults to None.

None
pad float

Extra padding (i.e., empty space) around the image in inches. Defaults to 0.1.

0.1
dpi float | figure

The resolution in dots per inch. If 'figure', use the figure's dpi value. Defaults to None.

'figure'
orbit_and_frame str | None

Metadata used in the formatting of the file name. Defaults to None.

None
utc_timestamp TimestampLike | None

Metadata used in the formatting of the file name. Defaults to None.

None
use_utc_creation_timestamp bool

Whether the time of image creation should be included in the file name. Defaults to False.

False
site_name str | None

Metadata used in the formatting of the file name. Defaults to None.

None
hmax int | float | None

Metadata used in the formatting of the file name. Defaults to None.

None
radius int | float | None

Metadata used in the formatting of the file name. Defaults to None.

None
resolution str | None

Metadata used in the formatting of the file name. Defaults to None.

None
extra str | None

A custom string to be included in the file name. Defaults to None.

None
transparent_outside bool

Whether the area outside figures should be transparent. Defaults to False.

False
verbose bool

Whether the progress of image creation should be printed to the console. Defaults to True.

True
print_prefix str

A prefix string to all console messages. Defaults to "".

''
create_dirs bool

Whether images should be saved in a folder structure based on provided metadata. Defaults to False.

False
transparent_background bool

Whether the background inside and outside of figures should be transparent. Defaults to False.

False
**kwargs dict[str, Any]

Keyword arguments passed to wrapped function call of matplotlib.pyplot.savefig.

{}
Source code in earthcarekit/plot/save/simple_save.py
def save_plot(
    fig: Figure | HasFigure,
    filename: str = "",
    filepath: str | None = None,
    ds: xr.Dataset | None = None,
    ds_filepath: str | None = None,
    pad: float = 0.1,
    dpi: float | Literal["figure"] = "figure",
    orbit_and_frame: str | None = None,
    utc_timestamp: TimestampLike | None = None,
    use_utc_creation_timestamp: bool = False,
    site_name: str | None = None,
    hmax: int | float | None = None,
    radius: int | float | None = None,
    resolution: str | None = None,
    extra: str | None = None,
    transparent_outside: bool = False,
    verbose: bool = True,
    print_prefix: str = "",
    create_dirs: bool = False,
    transparent_background: bool = False,
    **kwargs,
) -> None:
    """
    Save a figure as an image or vector graphic to a file and optionally format the file name in a structured way using EarthCARE metadata.

    Args:
        fig (Figure | HasFigure): A figure object (`matplotlib.figure.Figure`) or objects exposing a `.fig` attribute containing a figure (e.g., `CurtainFigure`).
        filename (str, optional): The base name of the file. Can be extended based on other metadata provided. Defaults to empty string.
        filepath (str | None, optional): The path where the image is saved. Can be extended based on other metadata provided. Defaults to None.
        ds (xr.Dataset | None, optional): A EarthCARE dataset from which metadata will be taken. Defaults to None.
        ds_filepath (str | None, optional): A path to a EarthCARE product from which metadata will be taken. Defaults to None.
        pad (float, optional): Extra padding (i.e., empty space) around the image in inches. Defaults to 0.1.
        dpi (float | 'figure', optional): The resolution in dots per inch. If 'figure', use the figure's dpi value. Defaults to None.
        orbit_and_frame (str | None, optional): Metadata used in the formatting of the file name. Defaults to None.
        utc_timestamp (TimestampLike | None, optional): Metadata used in the formatting of the file name. Defaults to None.
        use_utc_creation_timestamp (bool, optional): Whether the time of image creation should be included in the file name. Defaults to False.
        site_name (str | None, optional): Metadata used in the formatting of the file name. Defaults to None.
        hmax (int | float | None, optional): Metadata used in the formatting of the file name. Defaults to None.
        radius (int | float | None, optional): Metadata used in the formatting of the file name. Defaults to None.
        resolution (str | None, optional): Metadata used in the formatting of the file name. Defaults to None.
        extra (str | None, optional): A custom string to be included in the file name. Defaults to None.
        transparent_outside (bool, optional): Whether the area outside figures should be transparent. Defaults to False.
        verbose (bool, optional): Whether the progress of image creation should be printed to the console. Defaults to True.
        print_prefix (str, optional): A prefix string to all console messages. Defaults to "".
        create_dirs (bool, optional): Whether images should be saved in a folder structure based on provided metadata. Defaults to False.
        transparent_background (bool, optional): Whether the background inside and outside of figures should be transparent. Defaults to False.
        **kwargs (dict[str, Any]): Keyword arguments passed to wrapped function call of `matplotlib.pyplot.savefig`.
    """
    if not isinstance(fig, Figure):
        fig = fig.fig

    _stime: str = pd.Timestamp.now().strftime("%Y-%m-%d %H:%M:%S")

    try:
        if transparent_background:
            transparent_outside = True

        new_filepath = create_filepath(
            filename,
            filepath,
            ds,
            ds_filepath,
            orbit_and_frame,
            utc_timestamp,
            use_utc_creation_timestamp,
            site_name,
            hmax,
            radius,
            extra,
            create_dirs,
            resolution,
        )

        if transparent_outside:
            fig.patch.set_alpha(0)
        if transparent_background:
            for ax in fig.get_axes():
                ax.patch.set_alpha(0)

        if verbose:
            print(f"{print_prefix}Saving plot ...", end="\r")
        save_figure_with_auto_margins(
            fig,
            new_filepath,
            pad=pad,
            dpi=None if dpi == "figure" else dpi,
            **kwargs,
        )

        # Restore original settings
        if transparent_outside:
            fig.patch.set_alpha(1)
        if transparent_background:
            for ax in fig.get_axes():
                ax.patch.set_alpha(1)

        _etime: str = pd.Timestamp.now().strftime("%Y-%m-%d %H:%M:%S")
        _dtime: str = str(pd.Timestamp(_etime) - pd.Timestamp(_stime)).split()[-1]
        if verbose:
            print(f"{print_prefix}Plot saved (time taken {_dtime}): <{new_filepath}>")

    except ValueError as e:
        if verbose:
            print(f"{print_prefix}Did not create plot since an error occured: {e}")

shift_cmap

shift_cmap(
    cmap: str | Colormap | None,
    start: float = 0.0,
    midpoint: float = 0.5,
    stop: float = 1.0,
    name: str = "shifted_cmap",
) -> Cmap

Create a colormap with its center point shifted to a specified value.

This function is useful for data with asymmetric ranges (e.g., negative min and positive max) where you want the center of the colormap to align with a specific value like zero.

Parameters:

Name Type Description Default
cmap str | Colormap | None

Colormap to be modified

required
start float

Lower bound of the colormap range (value between 0 and midpoint). Defaults to 0.0.

0.0
midpoint float

New center point of the colormap (value between 0 and 1). Defaults to 0.5. For data ranging from vmin to vmax where you want the center at value v, set midpoint = 1 - vmax/(vmax + abs(vmin))

0.5
stop float

Upper bound of the colormap range (value between midpoint and 1). Defaults to 1.0.

1.0
name str

Name of the new colormap. Defaults to "shifted_cmap".

'shifted_cmap'

Returns:

Name Type Description
Cmap Cmap

New colormap with shifted center

Source code in earthcarekit/colormap/_shift_cmap.py
def shift_cmap(
    cmap: str | Colormap | None,
    start: float = 0.0,
    midpoint: float = 0.5,
    stop: float = 1.0,
    name: str = "shifted_cmap",
) -> Cmap:
    """Create a colormap with its center point shifted to a specified value.

    This function is useful for data with asymmetric ranges (e.g., negative min and
    positive max) where you want the center of the colormap to align with a specific
    value like zero.

    Args:
        cmap (str | Colormap | None): Colormap to be modified
        start (float): Lower bound of the colormap range (value between 0 and `midpoint`). Defaults to 0.0.
        midpoint (float): New center point of the colormap (value between 0 and 1). Defaults to 0.5.
            For data ranging from vmin to vmax where you want the center at value v,
            set midpoint = 1 - vmax/(vmax + abs(vmin))
        stop (float): Upper bound of the colormap range (value between `midpoint` and 1). Defaults to 1.0.
        name (str): Name of the new colormap. Defaults to "shifted_cmap".

    Returns:
        Cmap: New colormap with shifted center
    """
    from ._get_cmap import get_cmap

    cmap_old = get_cmap(cmap)
    cmap_new = shift_mpl_colormap(
        cmap_old,
        start=start,
        midpoint=midpoint,
        stop=stop,
        name=name,
    )
    cmap_new = get_cmap(cmap_new)
    cmap_new.categorical = cmap_old.categorical
    cmap_new.ticks = cmap_old.ticks
    cmap_new.labels = cmap_old.labels
    cmap_new.norm = cmap_old.norm
    cmap_new.values = cmap_old.values
    cmap_new.gradient = cmap_old.gradient
    cmap_new.circular = cmap_old.circular
    return cmap_new