Colormaps
Figure objects such as CurtainFigure accept matplotlib.colors.Colormap objects or a name string, which then retrieves the appropriate colormap from matplotlib, plotly, cmcrameri, and from a list of pre-defined colormaps for earthcarekit:
Create a colormap
Get by name
def plot_cmap(c):
import matplotlib.pyplot as plt
_, ax = plt.subplots(figsize=(6, 0.5))
plt.colorbar(plt.cm.ScalarMappable(cmap=c), cax=ax, orientation="horizontal", label=c.name)
plt.show()
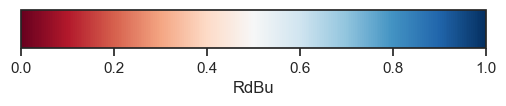
cmap = eck.get_cmap("RdBu")
plot_cmap(cmap)
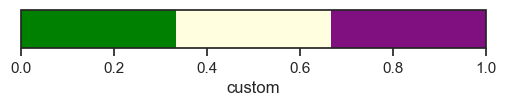
Generate from color list
colors = ["green", "#FFFFE0", (0.5, 0.06, 0.5, 1.0)]
cmap_custom = eck.Cmap(colors, name="custom")
plot_cmap(cmap_custom)
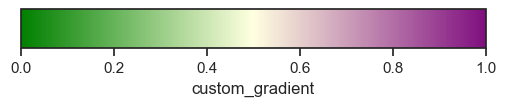
cmap_custom_gradient = eck.Cmap(colors, gradient=True, , name="custom_gradient")
cmap_custom_gradient.name = "custom_gradient"
plot_cmap(cmap_custom_gradient)
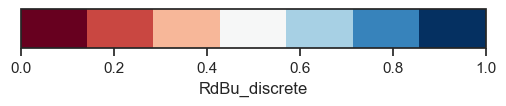
Convert a continous colormap to discrete
cmap_discrete = eck.get_cmap("RdBu").to_discrete(7)
cmap_discrete.name = "RdBu_discrete"
plot_cmap(cmap_discrete)
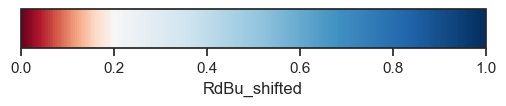
Shift the midpoint of a colormap
See shift_cmap.
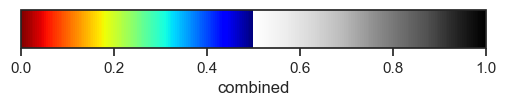
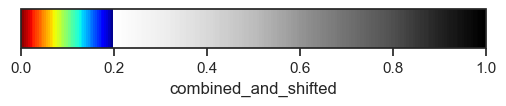
Combine colormaps
See combine_cmaps.
cmap_combined2 = eck.shift_cmap(cmap_combined, midpoint=0.2, name="combined_and_shifted")
cmap_combined2
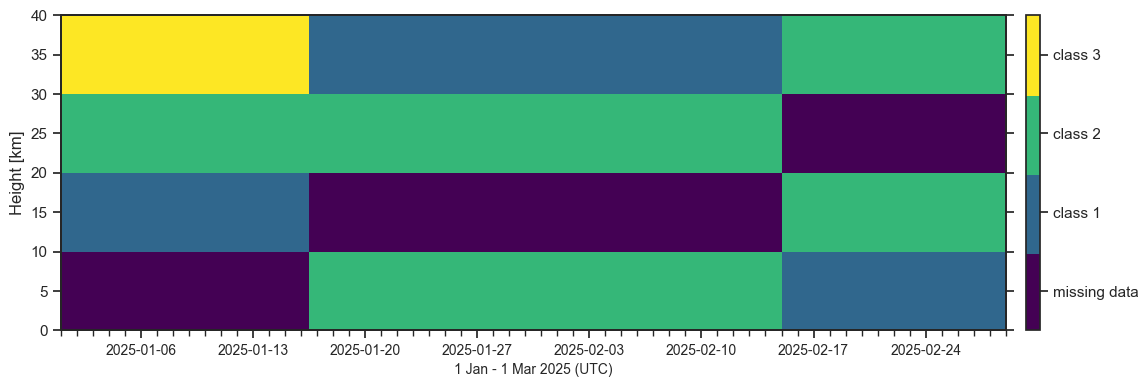
Categorical colormaps
For classification data (e.g., ATLID target classification) categorical colormaps can be created using the Cmap.to_categorical method:
cmap = eck.get_cmap("viridis")
values_to_labels = {
    0: "class 1",
    1: "class 2",
    100: "class 3",
    -1: "missing data",
}
cmap_categorical = cmap.to_categorical(values_to_labels)

# Example plot
eck.CurtainFigure().plot(
    values=[[-1,  0,  1, 100],
            [ 1, -1,  1,   0],
            [ 0,  1, -1,   1]],
    height=[5e3,15e3, 25e3, 35e3],
    time=["20250101", "20250201", "20250301"],
    cmap=cmap_categorical,
)